Nasdaq Scraper for Quotes, Calendars and Ownership Data

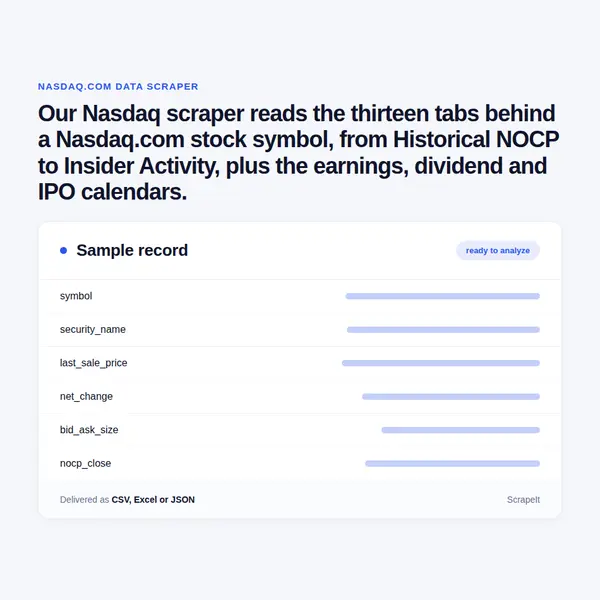
Our Nasdaq scraper reads the thirteen tabs behind a Nasdaq.com stock symbol, from Historical NOCP to Insider Activity, plus the earnings, dividend and IPO calendars.

Plans from €169 a month · Free project assessment · Reply within 1 business day

CSV · Excel · JSON · XML · FTP · SFTP · Amazon S3 · Google Cloud

nasdaq.com
Nasdaq Scraper for Quotes, Calendars and Ownership Data
nasdaq.comwhat you get
Typical fields for financial sites
tickerpricechange_pctvolumemarket_capupdated_at
Delivery

API, JSON feed or CSV, XLSX and JSON files

Schedule

One-time, monthly, weekly, daily or 3 times a day

How We Scrape Nasdaq Market Activity Pages

  1. You send

    Nasdaq pages, filters, fields and a schedule

  2. We run the scrapers

    Built, monitored and repaired by our team

  3. You receive the data

    API, JSON feed or CSV, XLSX and JSON files

You tell us what to cover - a ticker list, the members of an index, a sector picked in the Stock Screener, or every row of a calendar - and which tabs matter. We build the crawlers, run them on your schedule and repair them when Nasdaq.com changes a layout. Most figures on these pages are drawn in after the page loads, so rendering, pacing, proxy rotation and CAPTCHA handling are part of the job, not an extra.

Each run is compared with the previous one: a symbol whose Short Interest table comes back empty is fetched again before delivery instead of shipping as a blank row. Files arrive as CSV, XLSX, JSON or JSONLines, through our API or a JSON feed, on SFTP, Amazon S3 or straight into your database, with field documentation attached.

Nasdaq Stock Data: Fields We Extract per Symbol

A Nasdaq stock page is really thirteen pages under one symbol: Summary, Charts, News, Press Releases, Dividend History, Historical NOCP, Financials, Earnings, Option Chain, Short Interest, Institutional Holdings, Insider Activity and SEC Filings. We key every row on the symbol and the tab it came from, so the tables join cleanly.

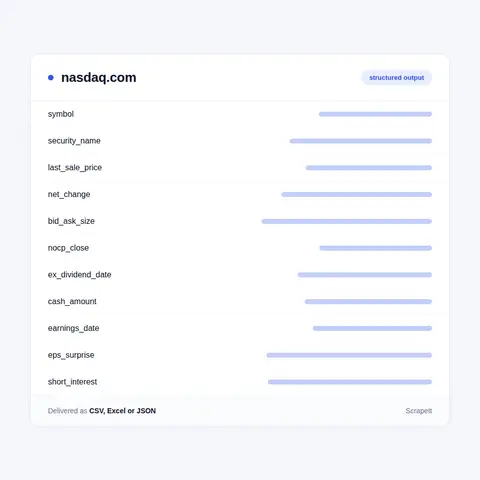
  • Quotesymbol, security name as Nasdaq prints it (for example Common Stock), last sale price, net and percent change, bid and ask with their sizes, and the Key Data block of the Summary tab.
  • Price historydaily price and volume rows for ranges from one month to MAX, plus the Historical NOCP table: the Nasdaq Official Closing Price set for Nasdaq-listed issues.
  • Dividendseach payment in Dividend History with its ex-dividend date, record and payment dates and cash amount. Nasdaq does not adjust this table for stock splits and may combine regular with special payouts; the field documentation notes both.
  • Earningsearnings date, estimated against reported EPS, the quarterly earnings surprise amount, yearly and quarterly earnings forecast, change in consensus, number of estimates changed and the earnings quality ranking.
  • Short interestsettlement date, shares sold short, average daily share volume and days to cover. Nasdaq rounds a days to cover value between zero and one up to one, and the column keeps that convention.
  • Ownershipthe Ownership Summary, the Active Positions block (new, increased, decreased and sold out positions) and the holder table built from institutional 13F reports.
  • Insider activitynumber of insider trades and insider shares traded, the split between buys and sells, and each transaction row, with insider names left out by default.
  • Optionscalls and puts from the Option Chain and its Greeks view.
  • Financialsthe statement tables, which Nasdaq states in USD thousands.

ETF pages carry a shorter tab set without Financials, Earnings or holdings, and the dataset marks which tabs each symbol has, so an empty column never hides a missing page.

Nasdaq Stock Data: Fields We Extract per Symbol
Nasdaq Price History, Calendars and Screener

Nasdaq Price History, Calendars and Screener

Beyond single symbols, Nasdaq.com runs calendars that change every trading day. The Earnings Calendar marks each report as Pre-Market, After Hours or Time Not Supplied; the Dividends Calendar lists coming ex-dates; the IPO Calendar splits deals into Upcoming, Priced, Filings and Withdrawn; Economic and Stock Splits calendars sit beside them. Collected daily, they become one event table you can join to your own ticker list.

The Stock Screener filters the market by exchange, market cap, analyst rating, sector, region and country, which makes it the natural seed for a universe: screen once, then crawl each symbol it returns.

Repeated runs build what a single visit cannot. Quotes saved on a schedule turn into a Nasdaq price history with your own timestamps; the IPO Calendar saved each day shows when a filing became a priced deal or was withdrawn; Short Interest and Institutional Holdings saved each reporting period show positions changing over time. Nasdaq also runs European Market Activity pages for the Nordic and Baltic markets, which fit the same schedule.

About Nasdaq.com and Its Market Activity Section

Source
nasdaq.com
Category
financial sites
Delivery
API, JSON feed, CSV, XLSX
Plans
From €169 a month
Get a quote

Nasdaq.com is the public website of Nasdaq, Inc., the operator of the Nasdaq Stock Market. Its Market Activity section is organised by asset class - Stocks, Options, ETFs, Mutual Funds, Indexes and Cryptocurrency - with IPOs, the Symbol Screener, U.S. Most Active and the Nasdaq Top 100 alongside. Everything hangs off the ticker: a stock page lives at /market-activity/stocks/ plus the symbol in lower case, and each tab adds its own segment, such as /dividend-history or /short-interest.

Not every tab covers every symbol. Nasdaq notes that Dividend History is only available for Nasdaq-listed symbols, and Historical NOCP is by definition a Nasdaq closing price. The tabs also run on different clocks: quotes move through the session, with index values delayed at least a minute; the earnings and dividend calendars change daily; short interest follows exchange reporting periods; institutional holdings come from 13F reports filed within 45 days of each quarter end; insider rows come from Forms 3 and 4.

A separate European Market Activity area covers shares, indexes, fixed income, ETPs, warrants and certificates on the Nordic and Baltic markets - Stockholm, Helsinki, Copenhagen, Iceland, Tallinn, Riga and Vilnius - and the First North growth market.

25Developers
500+Customers
1.5BPages extracted
15,000+Hours saved for our clients

Nasdaq scraping plans and pricing

Airplane

€199one-time

Setup fee included

100,000
One-time
Up to 5 days
7 days

Helicopter

€169/ mo

Setup fee €499

250,000
Monthly
Up to 5 days
14 days

Glasses

€229/ mo

Setup fee €499

1,000,000
Weekly
Up to 5 days
30 days

Microscope popular

€349/ mo

Setup fee €499

2,000,000
Daily
Same day
60 days

DNA

€549/ mo

Setup fee €799

3,000,000
3 times daily
Same day
90 days

Delivery: CSV, JSON or XLSX files, our API or a JSON feed. MCP server on request.

Full plan details

What Teams Do With a Nasdaq Dataset

Event-driven research runs on these tables. An earnings date with its Pre-Market or After Hours tag, the estimated and reported EPS and the surprise amount are the inputs of an earnings-reaction study; the Dividends Calendar and Dividend History feed income screens and ex-date calendars.

Positioning is the second use. Short interest with days to cover, read every reporting period, shows where bearish bets build up; the Active Positions block shows whether institutions added or sold out last quarter; insider buys and sells add the view from inside the company.

New-issue desks watch the IPO Calendar for deals moving from Filings to Upcoming to Priced, and index and ETF teams use Historical NOCP as the official close for Nasdaq-listed names. A Nasdaq price tracker can store the quote, the Key Data figures and the option chain at the same moment each day, so a backtest sees what a visitor saw at the time.

About ScrapeIt

ScrapeIt is a managed web scraping service. We build, run and maintain crawlers for market data sites where the numbers load after the page, change through the trading day and spread across many tabs per symbol - Nasdaq.com is a typical case. You describe the symbols, tabs and schedule; we deliver the tables with field documentation, after a free project assessment. Personal data is handled under GDPR, and we do not build profiles of insiders or analysts.

FAQ

Still unsure? Write to info@scrapeit.io

Which Nasdaq tabs can you collect for one ticker?

All public tabs of a stock page: Summary, Historical NOCP, Dividend History, Earnings, Financials, Option Chain, Short Interest, Institutional Holdings, Insider Activity and SEC Filings, plus news and press release headlines. ETF symbols have fewer tabs, and the dataset records which ones exist for each symbol.

How often should Nasdaq scraping run for short interest and holdings?

Match the source clock. Short interest changes once per exchange reporting period and institutional holdings once per quarter as 13F reports arrive, so weekly runs are plenty. Quotes and the earnings and IPO calendars change daily or faster, and we schedule those daily or several times a session.

Can you track Nasdaq new listings from Upcoming to Priced?

Yes. A daily snapshot of the IPO Calendar records each deal under Upcoming, Priced, Filings or Withdrawn, and comparing snapshots shows the day a deal changed status. Dates and deal terms can move between snapshots, so we store each day's values instead of overwriting them.

Do you offer a Nasdaq API for quotes and calendar data?

Yes. The ScrapeIt Nasdaq API returns the last sale price, bid and ask, Historical NOCP closes, dividend dates and IPO Calendar status as JSON from an endpoint we host, refreshed on the schedule you set. The same tables also come as CSV or XLSX files, a JSON feed or a load into your database.

Is it legal to scrape Nasdaq?

Yes. Quotes, calendars, dividend tables, short interest and the holdings summaries are shown to every visitor of Nasdaq.com without an account. We collect only publicly available data - everything a visitor can see on Nasdaq - and we collect it legally.

How it works

  1. 1

    Make a request

    You share your needs, expectations, and desired timeframe. We'll suggest the best solution based on your request and budget.

  2. 2

    We configure the crawlers

    Our specialists configure the crawlers and extract a sample dataset for your review before proceeding with the full-scale extraction.

  3. 3

    Collect and deliver

    Once you approve the sample, we launch the project and start full data collection. We gather, filter, and structure the data for easy use, delivering it on time in your preferred format.

  4. 4

    Maintain and support

    Our team manages ongoing processes, monitors website changes, and supports all data extraction cycles. We can also help integrate data into your systems or create dashboards to simplify analysis.

Request a quote

Tell us which sites, which fields and how often. A couple of lines is enough to start.

  • We reply within 1 business day
  • A sample dataset before the full run
  • We sign an NDA on request
  • Delivery by API, JSON feed or files
Which sites, which fields, how often. A couple of lines is enough.

This form is protected by Google reCAPTCHA, which loads when you start filling it in; the Google Privacy Policy and Terms of Service apply. If you prefer not to use it, email us at info@scrapeit.io. Privacy & Cookie Policy

We reply within 1 business day. No obligation.

Nasdaq data from €169/month. Free project assessment, reply within 1 business day.