TipRanks Scraper for Analyst Ratings and Price Targets

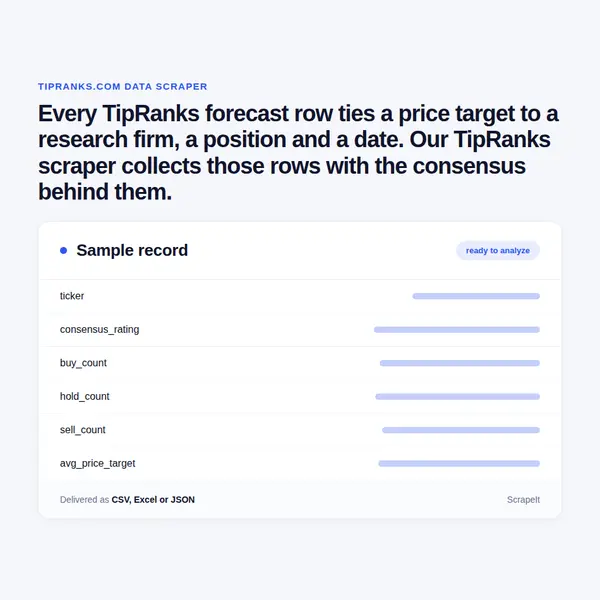
Every TipRanks forecast row ties a price target to a research firm, a position and a date. Our TipRanks scraper collects those rows with the consensus behind them.

Plans from €169 a month · Free project assessment · Reply within 1 business day

CSV · Excel · JSON · XML · FTP · SFTP · Amazon S3 · Google Cloud

tipranks.com
TipRanks Scraper for Analyst Ratings and Price Targets
tipranks.comwhat you get
Typical fields for financial sites
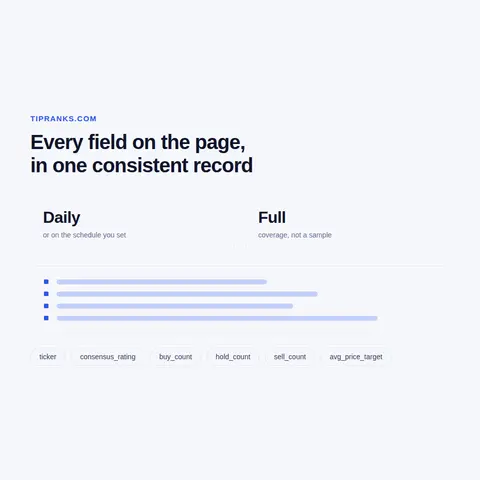
tickerpricechange_pctvolumemarket_capupdated_at
Delivery

API, JSON feed or CSV, XLSX and JSON files

Schedule

One-time, monthly, weekly, daily or 3 times a day

How Our TipRanks Data Service Works

  1. You send

    TipRanks pages, filters, fields and a schedule

  2. We run the scrapers

    Built, monitored and repaired by our team

  3. You receive the data

    API, JSON feed or CSV, XLSX and JSON files

This is a managed service. You name the tickers, sectors or screener views; we build the crawlers, run them and repair them whenever TipRanks reshapes a tab. Most projects start from a watchlist and read the forecast, stock analysis, insider trading and news tabs of each ticker. Others start from the analyst ranking and collect research firm, success rate and average return for every expert in a sector.

TipRanks meets unfamiliar traffic with bot protection, so pacing, proxy rotation, CAPTCHA handling and page rendering are part of the job, not your problem. We collect the layer an anonymous visitor sees: cells marked Premium or masked with placeholder characters are not in the dataset. Runs are one-off or on your schedule, and field documentation arrives with the first delivery.

TipRanks Price Target and Rating Fields We Extract

A TipRanks stock lives at /stocks/ plus its ticker, and listings outside the US carry a market prefix - gb: for London shares, whose targets are quoted in pence. Each tab of a stock becomes its own table joined on that ticker:

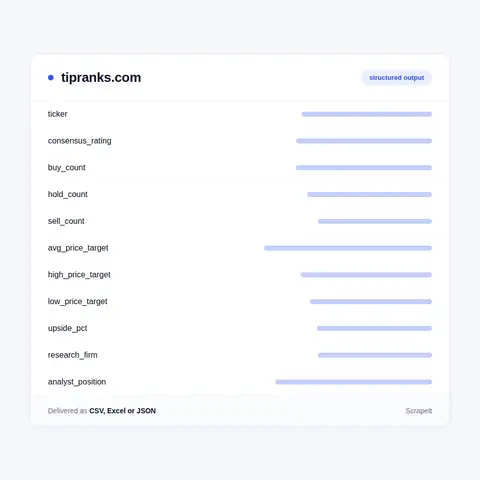
  • Consensusthe consensus label such as Moderate Buy, the total of ratings split into Buy, Hold and Sell, and the three-month window the count covers.
  • 12-month forecastaverage, high and low price target and the implied upside or downside from the last close.
  • Analyst forecastsone row per rating from the Detailed List of Analyst Forecasts: expert firm, price target, position, upside or downside, action such as reiterated, date and the linked article.
  • Recommendation trendsmonthly counts of Strong Buy, Buy, Hold, Sell and Strong Sell ratings.
  • Earnings forecasthigh, consensus and low estimates for earnings and sales.
  • Smart Scorethe whole-number score from 1 to 10, and its Outperform, Neutral or Underperform band.
  • Stock analysismarket cap, P/E, dividend yield, beta, revenue and EPS growth, sector, industry, next earnings date, earnings call sentiment, and the technical analysis block with moving averages, MACD, RSI and their verdicts.
  • Risk factorsthe count and the categories, from Finance and Corporate to Macro and Political, against the sector average.
  • Insider transactionsrole, transaction type, description, number of shares, amount, date and the SEC filing link.
  • News sentimentthis week's reading against the sector average, and per article the source, time, headline and its Bullish, Neutral or Bearish tag.

Each row keeps the ticker, the page address and the time we read it, so any price target in the file can be traced to the forecast page it came from. Analysts and insiders appear on TipRanks as named people in a professional role; by default the row carries the firm and the role, and the name is added only when your project needs it.

TipRanks Price Target and Rating Fields We Extract
TipRanks Historical Data From Repeated Runs

TipRanks Historical Data From Repeated Runs

A forecast page is a moving window: the consensus counts only ratings from the past three months, so older calls quietly drop out of it. TipRanks historical data therefore comes from repetition. Daily or weekly runs keyed on ticker, firm and date turn the analyst table into a price target history, showing when each firm moved its target and how the average, high and low shifted around an earnings date. Recommendation trends add a monthly view straight from the page.

Beyond single stocks we cover the lists TipRanks builds itself:

  • Analyst rankingresearch firm, sector, number of ratings, success rate, average return and followers, with the sector and period filters.
  • Best analysts covering a stockthe Most Accurate and Most Profitable views over three months, one year and two years.
  • Hedge Funds tabper fund the firm, activity, holding change, value reported and share of portfolio.

The Top Analysts view, the stock names in the Top Smart Score Stocks screener and other Premium-badged sections stay out of scope.

About TipRanks Financial Data and Its Tabs

Source
tipranks.com
Category
financial sites
Delivery
API, JSON feed, CSV, XLSX
Plans
From €169 a month
Get a quote

TipRanks is a stock research site built around one idea: track what market experts say and score how often they turn out right. Its financial data comes in layers - Wall Street analysts with their ratings and price targets, corporate insiders with their trades, financial bloggers, hedge fund managers, individual investors and the news flow. Experts are ordered by the TipRanks Star Ranking, which the site bases on success rate, average return and statistical significance.

The Smart Score condenses eight factors into one number: analyst ratings, insider transactions, blogger opinions, individual investor sentiment, hedge fund activity, news sentiment, technicals and fundamentals. TipRanks says six of the eight are its own data. Scores of 8 to 10 read Outperform, 4 to 7 Neutral, 1 to 3 Underperform.

For someone who needs the data, the organisation matters more than the scores. Everything hangs on the ticker page and its tabs - Analyst Forecasts, AI Stock Analysis, Earnings, Insider Trading, Hedge Funds, Crowd Wisdom, Blogger Opinion, ETF Exposure, Stock Buybacks, Options. The site runs a free layer and TipRanks Premium on top: the stock names in the Top Smart Score Stocks screener, Follow buttons and the Top Analysts view are locked, and some insider rows show placeholder characters. A dataset plan starts by marking which columns of each tab are open.

25Developers
500+Customers
1.5BPages extracted
15,000+Hours saved for our clients

TipRanks scraping plans and pricing

Airplane

€199one-time

Setup fee included

100,000
One-time
Up to 5 days
7 days

Helicopter

€169/ mo

Setup fee €499

250,000
Monthly
Up to 5 days
14 days

Glasses

€229/ mo

Setup fee €499

1,000,000
Weekly
Up to 5 days
30 days

Microscope popular

€349/ mo

Setup fee €499

2,000,000
Daily
Same day
60 days

DNA

€549/ mo

Setup fee €799

3,000,000
3 times daily
Same day
90 days

Delivery: CSV, JSON or XLSX files, our API or a JSON feed. MCP server on request.

Full plan details

Why Scrape TipRanks

TipRanks puts sell-side opinion into a table, which is what makes it useful as data. Typical projects:

  • Target revision trackingPrice target, position and date per firm, collected daily, show who raised or cut a target and how far the average moved after results.
  • Coverage monitoring for issuersInvestor relations teams follow which research firms cover their stock, the spread between high and low target and the drift of the consensus rating.
  • Analyst accuracy studiesSuccess rate and average return per expert, taken across sectors, feed research on which firms forecast a sector well.
  • Model featuresSmart Score, news sentiment against the sector average, insider transaction amounts and recommendation trends become inputs for quantitative screens on names such as AAPL, NVDA or MSFT and across whole sectors.
  • Event studiesThe next earnings date and earnings call sentiment let you line up rating changes with company events.

We deliver the data; what you conclude from it is yours, and nothing here is investment advice.

About ScrapeIt

ScrapeIt is a managed web scraping company. We build, run and maintain the crawlers and hand over finished datasets, so your analysts work with columns, not with page markup. Research sites like TipRanks need that approach: many tabs per ticker, a free layer next to a paid one, and figures that change after every analyst note. Start with a free project assessment or order a sample for a few tickers.

FAQ

Still unsure? Write to info@scrapeit.io

Do you offer a TipRanks API for price targets and ratings?

Yes. The ScrapeIt TipRanks API returns the average, high and low price target, the consensus label, Buy, Hold and Sell counts, the Smart Score and per-firm forecast rows as JSON from an endpoint we host, refreshed on the schedule you set. The same data also comes as CSV or XLSX files, a JSON feed or a load into your database.

Is it legal to scrape TipRanks?

Yes. Forecast pages, consensus ratings, insider transactions and news sentiment that TipRanks shows without a subscription are public. We collect only publicly available data - everything a visitor can see on TipRanks - and we collect it legally. Premium-only columns are not part of any dataset we deliver.

Can you get TipRanks historical data for price targets?

The page itself holds the current view: ratings from the last three months and monthly recommendation trends. A longer price target history is built from our runs - every snapshot is stored with its collection date, so after a few weeks you have a dated series per ticker and per research firm.

How do you handle analyst and insider names?

TipRanks shows analysts and insiders as named people acting in a professional role - an analyst at a research firm, an officer filing with the SEC. By default we deliver the firm, the role and the figures; names are added in that professional capacity only when the project needs them, handled under GDPR, and we never build profiles of individuals.

Can you scrape TipRanks for UK stocks and other non-US listings?

Yes. Tickers outside the US carry a market prefix on TipRanks, such as gb: for London listings, and their forecast pages show the same consensus, average, high and low target. We keep the prefix and the quote currency, pence for London, in separate columns so targets never mix with dollar figures.

How it works

  1. 1

    Make a request

    You share your needs, expectations, and desired timeframe. We'll suggest the best solution based on your request and budget.

  2. 2

    We configure the crawlers

    Our specialists configure the crawlers and extract a sample dataset for your review before proceeding with the full-scale extraction.

  3. 3

    Collect and deliver

    Once you approve the sample, we launch the project and start full data collection. We gather, filter, and structure the data for easy use, delivering it on time in your preferred format.

  4. 4

    Maintain and support

    Our team manages ongoing processes, monitors website changes, and supports all data extraction cycles. We can also help integrate data into your systems or create dashboards to simplify analysis.

Request a quote

Tell us which sites, which fields and how often. A couple of lines is enough to start.

  • We reply within 1 business day
  • A sample dataset before the full run
  • We sign an NDA on request
  • Delivery by API, JSON feed or files
Which sites, which fields, how often. A couple of lines is enough.

This form is protected by Google reCAPTCHA, which loads when you start filling it in; the Google Privacy Policy and Terms of Service apply. If you prefer not to use it, email us at info@scrapeit.io. Privacy & Cookie Policy

We reply within 1 business day. No obligation.

TipRanks data from €169/month. Free project assessment, reply within 1 business day.