How Can Web Scraping Technology Help the Finance Industry?
Web scraping automates the extraction and aggregation of financial data, makes it easier to find stocks, and allows you to predict the market based on the information.
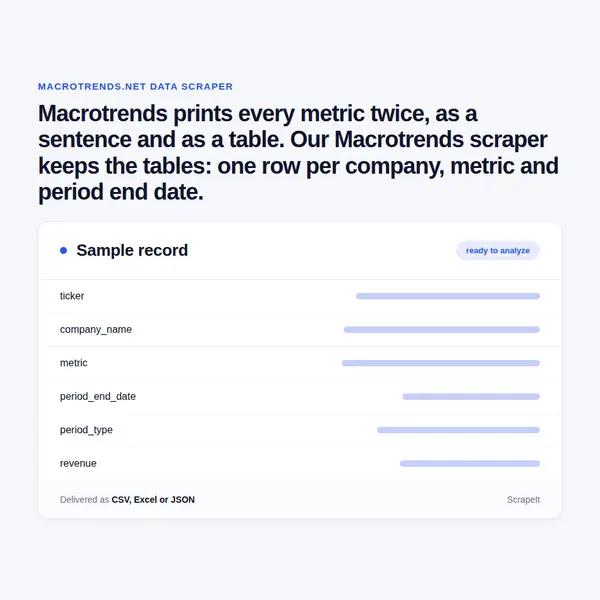
Macrotrends prints every metric twice, as a sentence and as a table. Our Macrotrends scraper keeps the tables: one row per company, metric and period end date.
Plans from €169 a month · Free project assessment · Reply within 1 business day
CSV · Excel · JSON · XML · FTP · SFTP · Amazon S3 · Google Cloud
API, JSON feed or CSV, XLSX and JSON files
ScheduleOne-time, monthly, weekly, daily or 3 times a day
Macrotrends pages, filters, fields and a schedule
Built, monitored and repaired by our team
API, JSON feed or CSV, XLSX and JSON files
Macrotrends scraping is hard to run yourself at volume: the site sits behind a bot check that turns away unfamiliar traffic, and one company profile spreads over dozens of URLs. You send the list - tickers, a screener result, a set of commodity and economy charts - and the metrics you need. We build the crawlers, run them one-off or on your schedule and keep them working; anti-bot handling, rendering, pacing and proxy rotation are part of the service.
Output arrives as CSV, XLSX, JSON or JSONLines, via our API, a JSON feed, Amazon S3, Dropbox or e-mail, with field documentation that names the Macrotrends page each column came from.
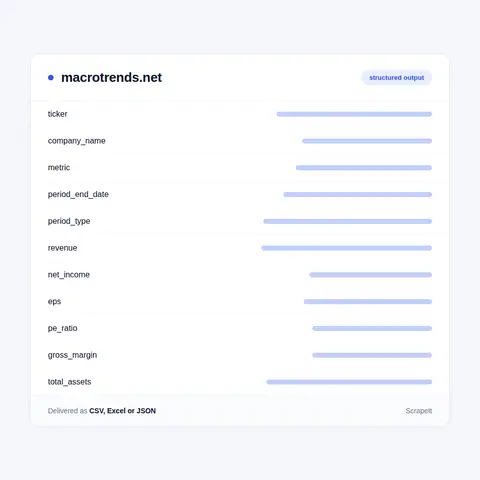
A Macrotrends company lives under one address pattern - /stocks/charts/AAPL/apple/ followed by the metric - and eight tabs: Prices, Financials, Revenue & Profit, Assets & Liabilities, Margins, Price Ratios, Other Ratios and Other Metrics. Each metric page opens with plain sentences about the latest quarter and year and then gives annual and quarterly tables. We take the tables, not the sentences, and key every value on ticker, metric and period end date.
Units stay as Macrotrends shows them - millions of dollars for statement lines, dollars per share for EPS, percentages for margins - and the documentation states each one.
The other half of the site is long-run chart pages. Precious metals cover gold, silver, platinum and copper; energy covers WTI and Brent crude, natural gas and heating oil; the commodities group covers corn, soybeans, wheat, cotton, coffee, oats, sugar, soybean oil and lumber. Index pages chart the Dow, the S&P 500 and the NASDAQ, and the economy pages cover GDP, GDP growth, GDP per capita, inflation and debt to GDP by country, with population and city rankings under Global Metrics.
Many series are inflation adjusted with the headline CPI: gold prices per ounce back to 1915, oil prices per barrel back to 1946, the S&P 500 as month-end closes. Wheat, by contrast, is a daily price in dollars per bushel. We record for each series whether it is real or nominal and in which unit.
The current month on these charts updates hourly, so repeated runs build what the page does not keep: a daily record of the latest value. The Stock Research page adds rankings - top stocks by market cap and by dollar volume, stocks by industry - that work as a seed list for a company crawl.
Macrotrends is a research site run by Macrotrends LLC under the line The Long Term Perspective on Markets. It is built for investors who think in decades rather than days: each company and each market series is drawn as a long chart with its table beneath, and the pages carry a credit line naming where the numbers come from.
The home page lists ten sections: Stock Screener, Stock Research, Market Indices, Precious Metals, Oil & Gas, Commodities, Exchange Rates, Interest Rates, Economy and Global Metrics. Company pages are the deepest part: each company has a slug of ticker and name, eight metric tabs and a financial statements view, so one company is several dozen pages. Commodity and macro pages are numbered instead, such as /1333/ for the gold chart, and often come in pairs - a long-run history page and a daily page.
The Stock Screener filters by market cap, PE ratio, dividend yield, price, P/B ratio, LT debt/equity, ROE, operating margin and net margin. Each company table covers the span of years its public page shows, and that is the span we collect; runs repeated over time extend a series from the day a project starts.
Delivery: CSV, JSON or XLSX files, our API or a JSON feed. MCP server on request.
Full plan detailsMacrotrends lines up ten years of quarterly fundamentals in the same layout for every company, which is what a factor or valuation study needs: PE ratio, price/book and price-FCF over many quarters, margins next to revenue growth, debt/equity and current ratio next to cash on hand. Collected for a whole sector, these tables make a peer panel without stitching statements together by hand.
The commodity and macro series serve a different crowd. Procurement and agricultural analysts use the long histories of wheat, corn, soybean, coffee and lumber prices for seasonality and long-cycle comparisons; macro researchers put inflation-adjusted gold and oil prices next to GDP and inflation by country.
Is Macrotrends data reliable enough for a model? Treat it like any secondary source: we keep the page URL, the source line and the capture date with every value, so a figure can be checked against the original filing or price series first.
Learn how to use web scraping to solve data problems for your organization

Web scraping automates the extraction and aggregation of financial data, makes it easier to find stocks, and allows you to predict the market based on the information.

Data and analytics are opening the door to uncovering ways to combat financial crime based on smart data. And advanced AI analytics and cognitive techniques, machine learning, and automation will improve the inefficiency of existing investigative processes.

Data scraping is the wide term that includes documents, scans and old screens; web scraping is the part that works on websites. We compare sources, daily work, output and cost drivers, give a briefing checklist and walk through two of our projects.

ScrapeIt is a managed scraping service for teams that need data rather than tools. Research sites like Macrotrends bring dozens of pages per company, tables that grow every quarter, and a bot check that stops casual crawling. A project starts with a free assessment, and a sample on your own tickers or series can come first; after that we build and run the crawlers and deliver the tables with documentation.
Still unsure? Write to info@scrapeit.io
Macrotrends prints a credit line on its pages: company fundamentals are attributed to an equity research provider, country series to an international statistics body. We store that line, the page URL and the capture date with each value, so every number in the delivery can be traced back.
Yes. We start from the Stock Screener or your ticker list, collect the metric tabs you choose for every company and key each value on ticker, metric and period end date. New quarters are appended as Macrotrends adds them, so the database keeps every period you have collected.
Metal, oil and index charts update their current month hourly, so daily or weekly runs suit price series. Company fundamentals change when a new quarter is reported, and a weekly or post-earnings run is usually enough; stock price history and PE ratio pages move with the market and can run daily.
Yes. The ScrapeIt Macrotrends API returns revenue, net income, EPS, PE ratio, gross margin and gold or oil price series as JSON from an endpoint we host, refreshed on the schedule you set. You can also take it as XLSX or CSV exports, a JSON feed or a load into your own warehouse.
Yes. The charts, tables and company metric pages are free content that Macrotrends publishes for every reader. We collect only publicly available data - everything a visitor can see on Macrotrends - and we collect it legally.
You share your needs, expectations, and desired timeframe. We'll suggest the best solution based on your request and budget.
Our specialists configure the crawlers and extract a sample dataset for your review before proceeding with the full-scale extraction.
Once you approve the sample, we launch the project and start full data collection. We gather, filter, and structure the data for easy use, delivering it on time in your preferred format.
Our team manages ongoing processes, monitors website changes, and supports all data extraction cycles. We can also help integrate data into your systems or create dashboards to simplify analysis.
Tell us which sites, which fields and how often. A couple of lines is enough to start.
Macrotrends data from €169/month. Free project assessment, reply within 1 business day.