How Can Web Scraping Technology Help the Finance Industry?
Web scraping automates the extraction and aggregation of financial data, makes it easier to find stocks, and allows you to predict the market based on the information.
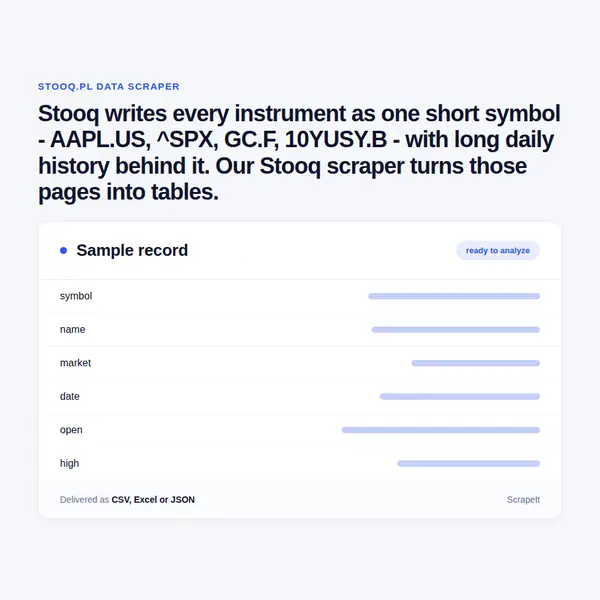
Stooq writes every instrument as one short symbol - AAPL.US, ^SPX, GC.F, 10YUSY.B - with long daily history behind it. Our Stooq scraper turns those pages into tables.
Plans from €169 a month · Free project assessment · Reply within 1 business day
CSV · Excel · JSON · XML · FTP · SFTP · Amazon S3 · Google Cloud
API, JSON feed or CSV, XLSX and JSON files
ScheduleOne-time, monthly, weekly, daily or 3 times a day
Stooq pages, filters, fields and a schedule
Built, monitored and repaired by our team
API, JSON feed or CSV, XLSX and JSON files
You send the symbols, or the lists they come from - WIG20 members, NASDAQ stocks, major government bond yields, metals - with the period and interval you need. We build the crawler, run it as often as the work needs and repair it when the site changes. Stooq checks the browser before it shows a quote, so anti-bot handling, rendering, pacing and proxy rotation are part of the service.
Because stooq.pl and stooq.com show the same instrument under Polish and English labels, we map both to one English schema. Volumes and turnover written with k, m and g multipliers become plain numbers, and every row keeps the symbol, the quote timestamp and the page it came from.
A Stooq quote page sits at /q/?s= plus the symbol, and the symbol carries the market: .US for American stocks, ^ for an index such as ^SPX, .F for futures such as CL.F, .B for bond yields such as 10YUSY.B, .V for crypto such as BTC.V, a six-letter pair for currencies such as EURUSD, and a plain ticker such as PKO for the Warsaw Stock Exchange. One schema covers all of them; a field a class does not have stays empty.
Warsaw-listed companies carry extra tabs. Profil adds address, website, ISIN, KRS and REGON numbers, first listing date, segment, sector and every index the stock belongs to with its weight; Akcjonariat adds free float and major shareholders such as the State Treasury and pension funds; Kalendarium is the company calendar. Board members and individual shareholders are persons and stay out by default.
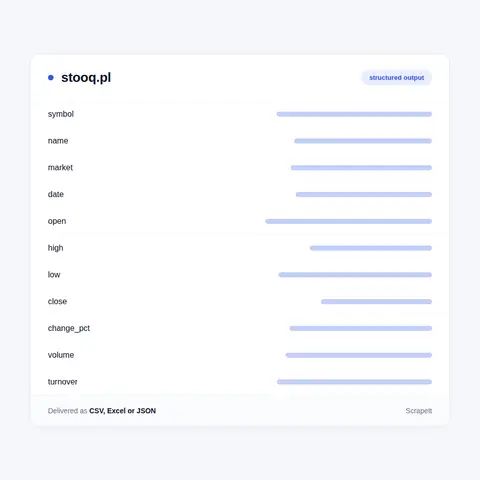
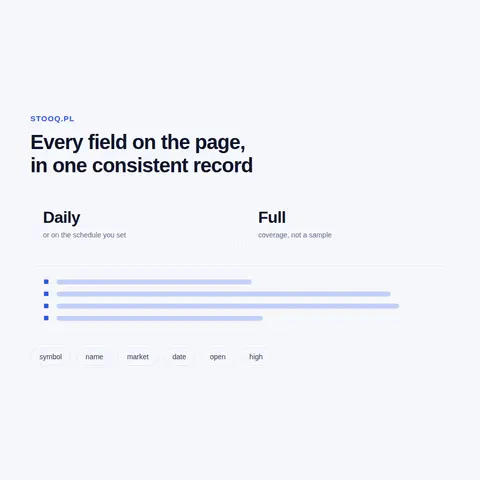
Stooq historical data sits on the Dane historyczne (historical data) tab of each symbol: a numbered table of sessions with date, open, high, low, close, change and volume. It switches between daily, weekly, monthly, quarterly and yearly intervals and can show prices with or without adjustment for splits, dividends, subscription rights and denominations. We record which setting each series was collected with, so adjusted and raw histories never mix.
Coverage starts from Stooq's lists, which page through symbols a hundred at a time with symbol, name, last price, change, volume and time. The menus group them by market: U.S., UK, German, Japanese, Hong Kong, Polish and Hungarian stocks, ETFs, world indices, currency majors and cryptocurrencies, energy, metals, grains and softs, government bond yields and prices, interbank rates such as WIBOR, SARON and HIBOR, and Warsaw futures, options, certificates and structured products.
A macro section adds CPI, PPI, GDP and retail sales year on year, PMI manufacturing, industrial production and the unemployment rate. Repeat runs on the same symbols append new sessions and keep the quote timestamp, so a daily file grows into an unbroken series.
Stooq is a Polish financial quotes site. It runs in Polish at stooq.pl and in English at stooq.com, with the same symbols, quote pages and history on both; on those pages only the labels change. The header clocks show local time beside New York, London and Tokyo, and the default comparison index on every quote chart is WIG20, which says where the site comes from. The Warsaw Stock Exchange (GPW) gets more depth than any other market, down to futures, options, certificates and structured products, and the Polish site adds a Fundusze section for investment funds.
The site is organised around the symbol rather than the article. Every instrument has the same tabs - summary, chart, historical data, and news where there is any - and the same quote block, whether it is a NASDAQ stock, a WTI futures contract or a government bond yield. That uniformity is why one crawler design can cover Polish stocks, global indices, currencies, commodities, bonds and crypto in a single schema.
Each quote carries its own date and time, and markets close at different hours, so we keep that stamp next to every price instead of assuming one closing time for all rows.
Delivery: CSV, JSON or XLSX files, our API or a JSON feed. MCP server on request.
Full plan detailsStooq's strength is breadth with long, uniform history, which suits work that compares instruments rather than following one.
Learn how to use web scraping to solve data problems for your organization
Web scraping automates the extraction and aggregation of financial data, makes it easier to find stocks, and allows you to predict the market based on the information.
Data and analytics are opening the door to uncovering ways to combat financial crime based on smart data. And advanced AI analytics and cognitive techniques, machine learning, and automation will improve the inefficiency of existing investigative processes.
Data scraping is the wide term that includes documents, scans and old screens; web scraping is the part that works on websites. We compare sources, daily work, output and cost drivers, give a briefing checklist and walk through two of our projects.

Our team at ScrapeIt runs scraping as a managed service. We collect market and economic data from quote sites, exchanges and statistics portals and deliver it as files or through our API, with documentation for every column. For Stooq we keep one English schema across the Polish and English sites and across asset classes, so a stock, a futures contract and a bond yield sit in the same table. Each run is one-off or repeats on the schedule you pick. Plans start from EUR 169 a month, or EUR 199 for a one-time extract.
Still unsure? Write to info@scrapeit.io
It depends on the instrument, and the chart range on each quote page names the first year: 1984 for AAPL.US, 2004 for PKO, 1971 for EURUSD, 1987 for Brent and 1871 for the US 10-year yield. We collect the whole range or only the window you need, at daily, weekly or monthly interval.
Yes. Every class shares the same quote block, so we deliver one table with a symbol column and an asset class column. Fields a class lacks stay empty: currency pairs show no volume, futures add open interest and contract rolls, and bond rows carry a yield in place of a price.
Yes. The ScrapeIt Stooq API returns symbol, date, open, high, low, close and volume, plus the last price and its timestamp, as JSON from an endpoint we host, refreshed on the schedule you set. The same data also comes as CSV or XLSX files, a JSON feed or a drop to SFTP or Amazon S3.
Either - the numbers are identical, only the labels differ. We read the version that fits the project, map Kurs, Zmiana, Wolumen and the other Polish labels to English column names, and keep the original names in the field documentation. The Fundusze (funds) section appears only in the menu of stooq.pl, so a funds project reads the Polish site.
Yes. Quote pages, historical tables, symbol lists and company profiles on stooq.pl and stooq.com are public pages that anyone can open. We collect only publicly available data - everything a visitor can see on Stooq - and we collect it legally.
You share your needs, expectations, and desired timeframe. We'll suggest the best solution based on your request and budget.
Our specialists configure the crawlers and extract a sample dataset for your review before proceeding with the full-scale extraction.
Once you approve the sample, we launch the project and start full data collection. We gather, filter, and structure the data for easy use, delivering it on time in your preferred format.
Our team manages ongoing processes, monitors website changes, and supports all data extraction cycles. We can also help integrate data into your systems or create dashboards to simplify analysis.
Tell us which sites, which fields and how often. A couple of lines is enough to start.
Stooq data from €169/month. Free project assessment, reply within 1 business day.