How Can Web Scraping Technology Help the Finance Industry?
Web scraping automates the extraction and aggregation of financial data, makes it easier to find stocks, and allows you to predict the market based on the information.
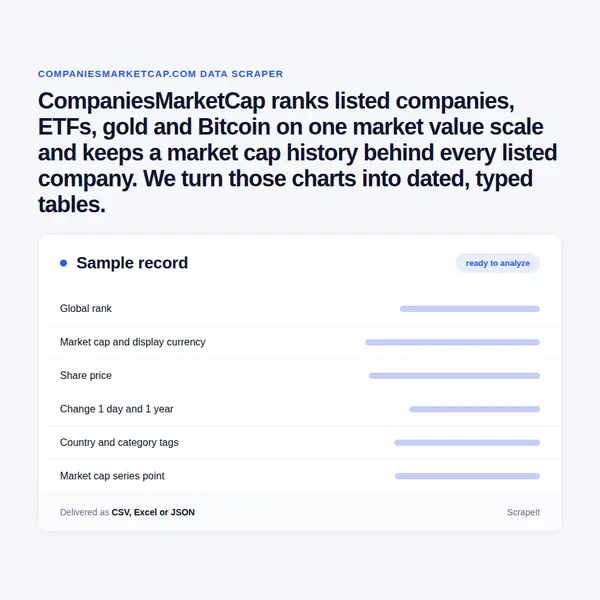
CompaniesMarketCap ranks listed companies, ETFs, gold and Bitcoin on one market value scale and keeps a market cap history behind every listed company. We turn those charts into dated, typed tables.
Scope starts from what you track - a ticker list, a country or category table, or the whole list - plus the tabs you need; a sample comes back for sign-off first. We read the embedded series and raw cell values, never the generated sentence above a chart, which on some tabs quotes a neighbouring metric. Units are normalized, gaps and N/A placeholder rows are flagged rather than filled, and every row keeps slug, site id, ticker, currency and capture time.
Each dataset gets its own clock: rankings daily after the US close, market cap series weekly to match the site's step, fundamentals after each earnings season. The crawler carries anti-bot handling, proxy rotation and CAPTCHA solving, because the site sits behind Cloudflare and a full CompaniesMarketCap scraping sweep runs to six figures of requests. Public pages only. Series ship as Parquet, rankings as CSV or XLSX, and either can land directly in your warehouse.
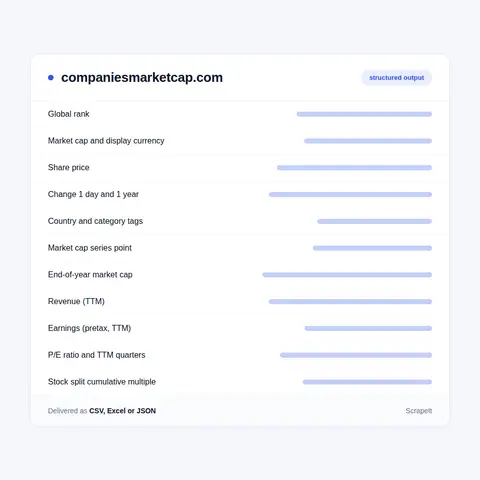
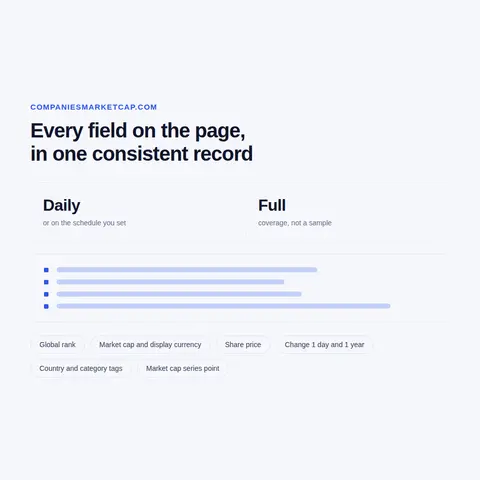
A company record opens with a fixed header, and the tabs behind it hold the company market cap data worth paying for. We extract CompaniesMarketCap data field by field:
Addresses are predictable: /{slug}/marketcap/ with sibling tabs such as /revenue/, /pe-ratio/ and /stock-splits/, a prefix like /eur/ or /inr/ for other currencies, and German and French editions that translate the tab segment - /de/apple/marktkapitalisierung/ - but keep the slug. Ranking rows are leaner: rank, name, ticker, one metric, price, today's change, a 30-day sparkline and country. Numeric cells carry a raw sort value - market cap in whole dollars, price in cents, change in hundredths of a percent - which we read instead of a label rounded to 5.532 T.
Depth. A market cap series begins at the end of January 1996 or at the listing date if that came later. Apple, IBM, Coca-Cola and Microsoft all start in 1996, although Apple's price tab reaches back to 1980; NVIDIA starts with its 1999 listing, Saudi Aramco at the end of 2019.
Step. Points fall on month ends through 2019 and about weekly from 2020, with irregular extras around 2020-2022 and a last point stamped with the moment the page was served. Resample to one calendar before computing returns.
Splits. Market cap runs straight through split dates - Apple's 4-for-1 in August 2020 and NVIDIA's 10-for-1 in June 2024 leave no step - while the price history is restated for splits, which is why Apple's 1982 low prints below four cents. The cumulative multiple in the split table (x224 for Apple) rebuilds as-traded prices.
Currency. Nine display currencies - USD, EUR, GBP, INR, CAD, AUD, NZD, HKD and SGD - each under its own URL prefix. Every point converts at the rate of its own date, not today's, and the euro edition reaches back to 1996, before the euro existed, so its early points rest on a reconstructed rate.
Other assets and snapshots. Gold's market cap is an estimate - price times 216,265 tonnes of above-ground stock per the World Gold Council, with a warning that estimates vary by up to 20 percent - and crypto rows have no page behind them. The time machine keeps the top 200 for any trading day since 4 January 2023.
CompaniesMarketCap.com ranks publicly listed companies by market value and by more than a dozen other yardsticks, and despite the name it has no tie to CoinMarketCap - its own footer says as much. In late September 2026 the global list counted 11,342 companies worth about $152.5 trillion, 100 rows to a page, and answered the question most visitors bring - which companies have the biggest market cap - with NVIDIA, Apple, Alphabet and Microsoft on top.
Beside it run rankings by revenue, earnings, number of employees, dividend yield, P/E and P/B ratio, operating margin, assets, debt, cash on hand and cost to borrow, plus daily gainers and losers; 52 country tables and a European Union table; 160 categories that work as overlapping tags rather than sectors; 45 ETF tables; and one mixed top 100 where gold, silver, Bitcoin and the largest index funds sit between the companies.
The site does not name the vendor behind its prices and financial statements. The outside sources it cites are narrow: Nasdaq for an end-of-day cross-check on US-traded names, the SEC for fails to deliver, Interactive Brokers for borrow fees, the World Gold Council and CPM Group for metal stock estimates. Prices run minutes to hours behind, and the terms promise nothing on accuracy or timeliness. Three habits of the data call for a second source: a year of revenue or earnings is the twelve months to December, not the fiscal year, so Microsoft's 2024 revenue shows as $261.8 billion against $245.1 billion in the 10-K for its fiscal year to June; earnings means pretax income; and for foreign companies with US-traded shares the figure can drift from the one Nasdaq reports - by about a tenth for Toyota in September 2026.
Get a Quote
Developers

Customers worldwide

Pages extracted

Hours saved for our clients
€199 / one-time
setup fee - included
€169 / mo
setup fee €499
€229 / mo
setup fee €499
€349 / mo
setup fee €499
€549 / mo
setup fee €799
There is no CompaniesMarketCap API. The site has no developer page, no key signup and no documented endpoints, so a search for a companies market cap API ends at one feature: the Download the list button on each ranking. It exports the whole table as CSV - rank, name, symbol, one metric column, price in the chosen currency and country - which is fine for a snapshot of today's order.
That is also where it stops. The file carries no history, no revenue or ratio series, no splits and no ETF holdings; the time machine and the mixed asset table have no button at all; and the dividend yield column is written in hundredths of a percent, so Apple's 0.31 percent arrives as 31.08. Everything historical lives inside the charts on each company page.
So teams scrape CompaniesMarketCap when one CSV of today's ranking is not the job: a backtest of rank changes, a market concentration study, a peer set that refreshes itself, a newsroom chart of the trillion-dollar club. Each needs companies market cap historical data for hundreds or thousands of names at once, and a full pass over every company and tab runs to a couple of hundred thousand pages.
Learn how to use web scraping to solve data problems for your organization

Web scraping automates the extraction and aggregation of financial data, makes it easier to find stocks, and allows you to predict the market based on the information.

Data and analytics are opening the door to uncovering ways to combat financial crime based on smart data. And advanced AI analytics and cognitive techniques, machine learning, and automation will improve the inefficiency of existing investigative processes.

Leveraging advances in technology, the AI-powered web scraper has skyrocketed in demand and is helping to expand capabilities by automating tedious daily tasks and speeding up data collection from thousands of websites several times over.
ScrapeIt is a managed web scraping agency. For CompaniesMarketCap that means we own the parsers for the chart series and the ranking tables, keep them working when the markup changes, and ship on a fixed timetable. ScrapeIt is independent of CompaniesMarketCap and gives no investment advice.
When a series will feed a published index, a fund report or a trading model, add a primary source: closing prices from the listing exchange and share counts from 10-K and 10-Q cover pages. Our SEC EDGAR collection can run beside this feed so each weekly point has a filed number to be checked against.
No official CompaniesMarketCap API exists: no developer documentation, no key signup, and the terms mention premium plans but no data feed. What the site does offer is a Download the list button on each ranking, which returns the full table as CSV: rank, name, symbol, one metric such as marketcap or revenue_ttm, price in the chosen currency, and country. That is a snapshot of the moment, not a series. For history, splits, fundamentals or ETF holdings, scraping the CompaniesMarketCap company pages is the working stand-in for a companies market cap API.
On CompaniesMarketCap it lives in the chart on each company's market cap page: every point from the end of January 1996, or from the listing date, to today - month ends through 2019, about weekly after that - plus an end-of-year table. We extract all points, convert them from the chart's units of 100,000 into full currency amounts and tag each row with ticker, slug and capture time. For a daily view by rank, the time machine covers the top 200 on every trading day since 4 January 2023. Daily values before 2020 have to be rebuilt from exchange closes and filed share counts.
The global list spans 81 countries, 52 of them with their own ranking, plus a European Union table. Tickers carry exchange suffixes - .T for Tokyo, .NS for India's NSE, .L for London, .SR for Saudi Arabia - while some foreign giants appear under a US ticker, TSMC as TSM and Tencent as TCEHY, and SAP sits in the German table under its New York symbol. Joins therefore need a mapping table; ETF holdings pages help by printing an ISIN for every position. Values come in nine display currencies, and the German and French editions keep the same company slugs.
The site's footer says stock prices are delayed by anything from a few minutes to several hours, so rankings shift through the trading day. The market cap chart gains a point a week, fundamentals move when quarterly reports land, fails to deliver follow the SEC's twice-monthly release, borrow fees change daily and ETF holdings carry a month-end date. We usually run rankings daily after the US close and history weekly. Files go out as CSV, JSON, Parquet or XLSX to S3 or SFTP, or are loaded into your database.
robots.txt closes only the archive of annual, quarterly, ESG and investor presentation reports and leaves rankings and metric pages open. The terms allow sharing and redistribution for editorial use - news, journalism, commentary - with clear attribution to CompaniesMarketCap.com, while other non-editorial or commercial reproduction needs the site's explicit permission. Collection stays on public pages, with no sign-in. The site lists companies, funds and commodities rather than people, so there is no personal data to hold. Whether your use counts as editorial is for your legal team to settle before launch.
Step 1 - Make a Request
You share your needs, expectations, and desired timeframe. We’ll suggest the best solution based on your request and budget.
Step 2 - Configuring Custom Web Crawlers
Our specialists configure the crawlers and extract a sample dataset for your review before proceeding with the full-scale extraction.
Step 3 - Collect and Deliver
Once you approve the sample, we launch the project and start full data collection. We gather, filter, and structure the data for easy use, delivering it on time in your preferred format.
Step 4 - Maintain and Support
Our team manages ongoing processes, monitors website changes, and supports all data extraction cycles. We can also help integrate data into your systems or create dashboards to simplify analysis.

Scrapeit Sp. z o.o.
10/208 Legionowa str., 15-099, Bialystok, Poland
NIP: 5423457175
REGON: 523384582