NHL Scraper for Schedules, Standings and Player Stats

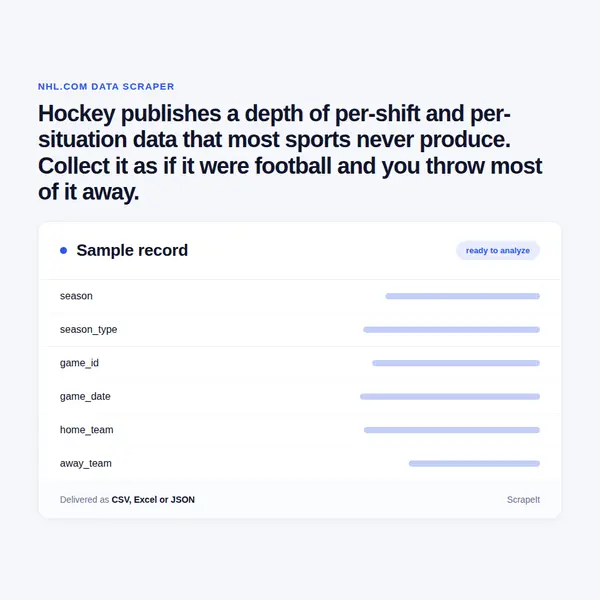
Hockey publishes a depth of per-shift and per-situation data that most sports never produce. Collect it as if it were football and you throw most of it away.

NHL Scraper
Solutions

Managed NHL data collection, run end to end by us

ScrapeIt runs the collection as a managed service. You name the seasons, teams and the depth of statistics; we build the pipeline against the structured layer where it is available, run the backfill once and the in season updates around gamedays, and hand back CSV, JSON, Excel or a push into your warehouse, with goaltenders typed separately and situational splits preserved.

Cadence in season is gameday driven. Schedules are known in advance, standings move after games and statistics settle shortly afterwards.

We read structured responses rather than driving a browser across rendered pages, and we pace what we send. Competition data is a compilation with rights attached and official sites carry terms on automated collection and reuse, so the dataset is for analysis and internal product use rather than republication. If your use case touches betting, take it to your own counsel first.

NHL fields in every export

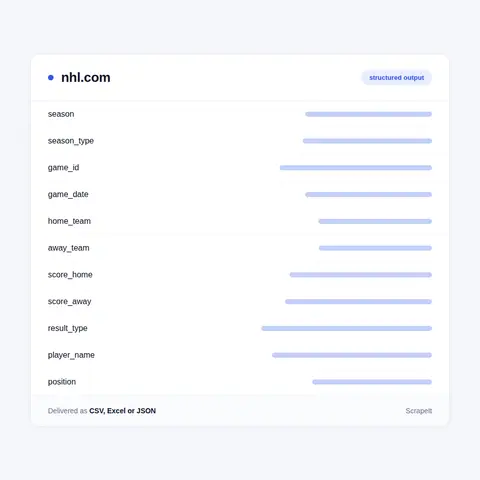
Schedule and result records cover season, season type, game identifier, date, start time in local and UTC, home and away team, venue, attendance where published, and the score including how the game ended, since overtime and shootout results carry different standings value.

That last point deserves its own field rather than a footnote. A regulation win, an overtime win and a shootout win award different points, and a standings table cannot be computed correctly without knowing which occurred.

Standings records carry season, date, conference and division, position, games played, wins, losses, overtime losses, points, points percentage and the tiebreak columns the league actually uses.

Player records carry identifier, name, team, position, shot handedness, date of birth, and the statistics hockey publishes: goals, assists, points, plus minus, penalty minutes, time on ice, shifts, power play and short handed splits, faceoff percentage and shot attempts where reported.

Goaltenders are kept as their own record type with saves, save percentage, goals against average and shutouts, because forcing them into a skater schema loses everything that matters about them.

NHL fields in every export
Goaltenders, playoffs and joining to other sources

Goaltenders, playoffs and joining to other sources

Goaltenders need their own record type. Their statistics share almost nothing with skaters, and flattening them into one table produces columns that are null for most rows and misleading for the rest.

Playoff data is collected as its own season type with the series structure preserved: which teams met, in which round, and the game order within the series. Collapsed into a flat game list it loses the series, which is the unit people actually analyse.

Joining to other sources follows the same entity work as elsewhere in this section. Player names in hockey carry diacritics from several European languages, and they are routinely stripped in one source and present in another, so matching runs on birth date, team and position rather than on strings.

Historical backfill is practical and, as always in sports, immutable once collected. A multi season panel is a one time job after which the in season feed is light: gameday plus a settle window.

A league that publishes more detail than most

The official NHL site carries schedules, results, standings, team and player statistics across the regular season and the playoffs. What distinguishes it from most league sites is depth: hockey reports time on ice, shifts, power play and penalty kill situations, faceoffs and shot attempts as standard, and a great deal of that is published.

That changes the shape of the data. A football record is largely per match; a hockey record is per match, per period and frequently per situation. A collector designed around a single row per player per game discards most of what the league actually publishes.

Structurally the schedule and statistics sections respond directly, and the site renders from structured data rather than static documents, so the collection approach is the same as on other modern league sites: read the structured layer where available and keep the request count low.

The season shape also matters. Regular season, playoffs and the draft each produce different data with different cadences, and treating them as one continuous stream produces charts with unexplained gaps and spikes.

Get a Quote
dev_w
25

Developers

customers
500+

Customers worldwide

pages
1 500 000 000+

Pages extracted

stime
15000+

Hours saved for our clients

Plans

Airplane

€199 / one-time

setup fee - included

Data limits100,000
Frequencyone-time
Run timeup to 5 days
Data storing7 days

Helicopter

€169 / mo

setup fee €499

Data limits250,000
Frequencymonthly
Run timeup to 5 days
Data storing14 days

Glasses

€229 / mo

setup fee €499

Data limits1,000,000
Frequencyweekly
Run timeup to 5 days
Data storing30 days

DNA

€549 / mo

setup fee €799

Data limits3,000,000
Frequency3 times daily
Run timesame day
Data storing90 days

Why hockey data needs a hockey schema

The common failure on this source is reuse. A team builds a football pipeline, points it at hockey and keeps the fields that overlap. What survives is goals and assists; what is lost is time on ice, situational splits and the difference between an overtime and a regulation result, which is most of the analytical value.

Time on ice is the clearest example. In hockey, playing time varies enormously between players in the same game, so a raw goal count without minutes is close to meaningless. Any per sixty analysis, which is the standard unit in the sport, needs the minutes captured.

Situational splits are the second. Even strength, power play and short handed are different games, and a player's production in one says little about the others. The league publishes the splits; a schema that ignores them discards a published distinction rather than an inferred one.

The third is the standings arithmetic. Overtime and shootout losses award a point, so a table computed from wins and losses alone will be wrong. Recording how each game ended is what makes a standings series reproducible.

The fourth is season type. Regular season and playoff data behave differently and should be filterable rather than blended, and the draft produces its own records entirely.

Our Blog

Reads Our Latest News & Blog

Learn how to use web scraping to solve data problems for your organization

How Artificial Intelligence Is Used In Web Scraping

How Artificial Intelligence Is Used In Web Scraping

Leveraging advances in technology, the AI-powered web scraper has skyrocketed in demand and is helping to expand capabilities by automating tedious daily tasks and speeding up data collection from thousands of websites several times over.

What is Web Scraping and What is it Used For?

What is Web Scraping and What is it Used For?

Web scraping is a method of obtaining web data by extracting it from pages of web resources with the help of a program, that is, in automatic mode. It is used to syntactically convert web pages into more usable forms.

Web Scraping for Machine Learning

Web Scraping for Machine Learning

If you specialize in machine learning, you need to feed large amounts of data to the algorithms. Web scraping is the easiest and the most efficient method of collecting the data from all over the Internet.

scrapeit logo

Who builds and keeps your NHL feed

ScrapeIt is a managed extraction company, not a tool you have to learn. Our team builds the pipeline, watches it through the season and into the playoffs, and repairs it before gameday.

You see a sample first, in your format, across the seasons and teams you need, with situational splits and goaltender records included so you can see the depth before committing.

FAQ

Why can I not just reuse my football schema?

Because what survives the reuse is goals and assists, and what is lost is time on ice, situational splits and how each game ended - which is most of the analytical value in hockey. Playing time varies enormously between players in the same game, so a goal count without minutes is close to meaningless.

Do you capture overtime and shootout results?

Yes, as their own field. A regulation win, an overtime win and a shootout win award different points, so a standings table computed from wins and losses alone is simply wrong. Recording how each game ended is what makes a standings series reproducible.

Are goaltenders handled separately?

Yes, as their own record type with saves, save percentage, goals against average and shutouts. Their statistics share almost nothing with skaters, and flattening both into one table produces columns that are null for most rows and misleading for the rest.

Can playoffs be separated from the regular season?

Yes, by season type, and the playoff series structure is preserved: which teams met, in which round, and the game order within the series. Collapsed into a flat game list the series is lost, and the series is the unit people analyse.

How do you match players against other sources?

On birth date, team and position rather than on names. Hockey player names carry diacritics from several European languages and are routinely stripped in one source and present in another, which makes string matching unreliable in exactly the cases that matter.

How does it Work?

Step 1 - Make a Request

You share your needs, expectations, and desired timeframe. We’ll suggest the best solution based on your request and budget.

Step 2 - Configuring Custom Web Crawlers

Our specialists configure the crawlers and extract a sample dataset for your review before proceeding with the full-scale extraction.

Step 3 - Collect and Deliver

Once you approve the sample, we launch the project and start full data collection. We gather, filter, and structure the data for easy use, delivering it on time in your preferred format.

Step 4 - Maintain and Support

Our team manages ongoing processes, monitors website changes, and supports all data extraction cycles. We can also help integrate data into your systems or create dashboards to simplify analysis.

Request a Quote

Tell us more about you and your project information.
Which sites, which fields, how often. A couple of lines is enough.

We reply within 1 business day. No obligation.

scrapiet

Scrapeit Sp. z o.o.
10/208 Legionowa str., 15-099, Bialystok, Poland
NIP: 5423457175
REGON: 523384582