How Can Web Scraping Technology Help the Finance Industry?
Web scraping automates the extraction and aggregation of financial data, makes it easier to find stocks, and allows you to predict the market based on the information.
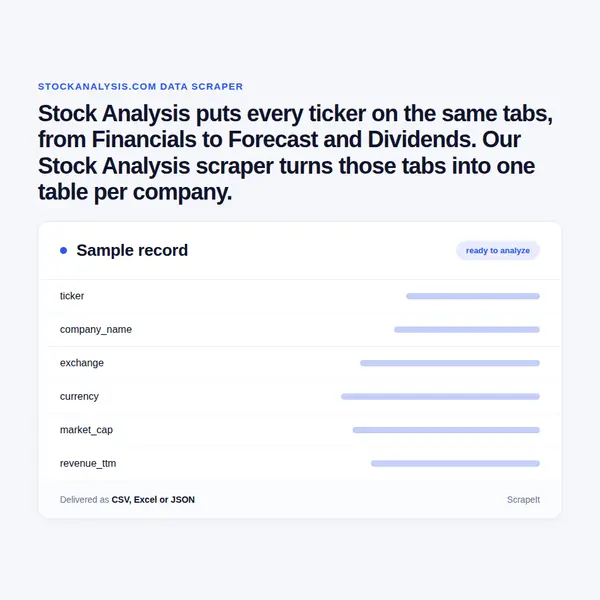
Stock Analysis puts every ticker on the same tabs, from Financials to Forecast and Dividends. Our Stock Analysis scraper turns those tabs into one table per company.
Plans from €169 a month · Free project assessment · Reply within 1 business day
CSV · Excel · JSON · XML · FTP · SFTP · Amazon S3 · Google Cloud
API, JSON feed or CSV, XLSX and JSON files
ScheduleOne-time, monthly, weekly, daily or 3 times a day
Stock Analysis pages, filters, fields and a schedule
Built, monitored and repaired by our team
API, JSON feed or CSV, XLSX and JSON files
This is a managed service. You give us the scope - a ticker list, a sector or industry page, an exchange from the Stock Exchanges list, or a filter set from the stock screener - and the tabs you need. We build the crawlers, run them on your schedule and repair them when a table changes its layout or gains a column. Anti-bot handling - pacing, proxy rotation, CAPTCHA handling and rendering - is part of the service.
To scrape Stock Analysis so the rows stay comparable, we record the period type (Annual, Quarterly or TTM), the fiscal year label with its period-ending date and the units note above each table. A company whose fiscal year runs from October to September then never lines up wrongly against a calendar-year one. Plans start from EUR 169 a month, or EUR 199 for a one-time extract.
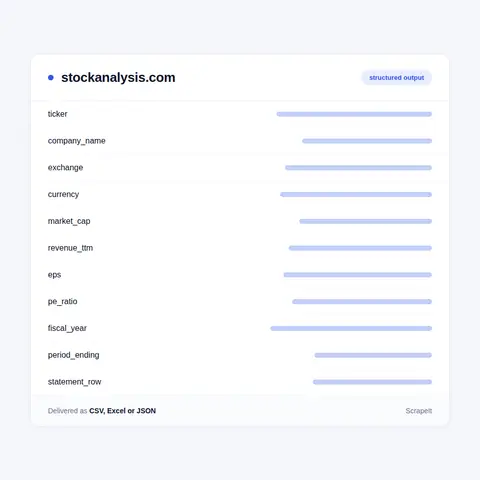
Every stock on the site is one address with a fixed row of tabs - Overview, Financials, Forecast, Statistics, Metrics, Dividends, History and Profile. We map each tab to its own group of columns, keyed on the ticker and the exchange:
Field documentation comes with the dataset and names the tab and the on-page label behind every column, so an analyst can check any value against the page it came from.
A single ticker is the small case. Most projects start from a list page and fan out from there:
Repeated runs add what one pass cannot: dated snapshots of ratios, price targets and ETF weights, which show when a consensus or a fund position moved.
Stock Analysis, at stockanalysis.com, is a free stock research site founded in 2019 and operated by Vefir ehf., a company registered in Iceland. It covers stocks, IPOs, ETFs and private companies, with a paid Pro tier above the free layer. For a data buyer the useful part is how uniform it is: every ticker gets the same tabs with the same labels, so one extractor reads a mega-cap and a small-cap the same way.
US listings sit at /stocks/ plus the lowercase ticker, and share classes are written with a dot. Listings elsewhere sit under /quote/ with an exchange code - lon for the London Stock Exchange, for example - and the exchange directory reaches from Frankfurt and Tokyo to Warsaw and Johannesburg. Each table states its units and fiscal year in a note, such as financials in millions USD. London stocks quote prices in GBX (pence), while their financials come in pounds or, for some companies, in US dollars - exactly the kind of detail a merged table has to carry.
The free layer ends at marked points: later years in the forecast tables show a Pro or Upgrade label, and ETF holdings past the top of the list ask for a subscription. We collect what a visitor sees without paying.
Delivery: CSV, JSON or XLSX files, our API or a JSON feed. MCP server on request.
Full plan detailsStock Analysis is useful when you need the same fundamentals for many companies without assembling them by hand. Typical uses, each tied to a tab:
We deliver data, not recommendations: what a ratio means for a portfolio is your call.
Learn how to use web scraping to solve data problems for your organization

Web scraping automates the extraction and aggregation of financial data, makes it easier to find stocks, and allows you to predict the market based on the information.
Data and analytics are opening the door to uncovering ways to combat financial crime based on smart data. And advanced AI analytics and cognitive techniques, machine learning, and automation will improve the inefficiency of existing investigative processes.
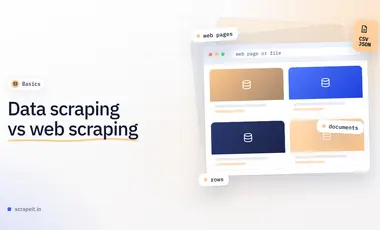
Data scraping is the wide term that includes documents, scans and old screens; web scraping is the part that works on websites. We compare sources, daily work, output and cost drivers, give a briefing checklist and walk through two of our projects.

ScrapeIt is a managed web scraping service. We build, run and maintain crawlers for financial sites where the value sits in wide tables - statements with dozens of rows, ratio pages, calendars that change every week - and deliver them on a stable schema as CSV, Excel or JSON, to Amazon S3 or into your database. A free project assessment comes first, a sample can be ordered before any plan starts, and runs are one-off or on the schedule you set. An MCP server is available on request.
Still unsure? Write to info@scrapeit.io
Yes. The ScrapeIt Stock Analysis API returns ticker, market cap, revenue (ttm), EPS, PE ratio and the average price target as JSON from an endpoint we host, refreshed on the schedule you set. The same data also comes as CSV or Excel files, a JSON feed or a load into your database.
Yes. Quotes, financial statements, statistics, dividend history and the IPO calendar are open to any visitor without an account. We collect only publicly available data - everything a visitor can see on Stock Analysis - and we collect it legally. The Forecast tab names individual analysts; we keep the firm and the rating and leave the names out by default.
From the Forecast tab: the Low, Average, Median and High target, the Recommendation Trends counts from Strong Buy to Strong Sell, and the revenue and EPS estimates. We take the years shown to every visitor; cells marked Pro are not part of the dataset. Weekly runs turn the target into a history of how the consensus moved.
It depends on the tab. Prices, volume and market movers change during the session, so those runs go daily or more often. Statements and ratios change after each report, so a weekly pass or one timed to the Earnings Date field keeps them current, while dividend history and the IPO calendar sit in between.
Yes. US tickers live at /stocks/ plus the symbol, while other markets use /quote/ plus an exchange code and symbol, such as lon for London. We keep the exchange code, the trading currency and the reporting currency on every row, because London listings quote prices in pence while their financials may be reported in pounds or in US dollars.
You share your needs, expectations, and desired timeframe. We'll suggest the best solution based on your request and budget.
Our specialists configure the crawlers and extract a sample dataset for your review before proceeding with the full-scale extraction.
Once you approve the sample, we launch the project and start full data collection. We gather, filter, and structure the data for easy use, delivering it on time in your preferred format.
Our team manages ongoing processes, monitors website changes, and supports all data extraction cycles. We can also help integrate data into your systems or create dashboards to simplify analysis.
Tell us which sites, which fields and how often. A couple of lines is enough to start.
Stock Analysis data from €169/month. Free project assessment, reply within 1 business day.