How Can Web Scraping Technology Help the Finance Industry?
Web scraping automates the extraction and aggregation of financial data, makes it easier to find stocks, and allows you to predict the market based on the information.

TradingView publishes ratings, ratios and performance figures already computed, symbol by symbol. Our TradingView scraper turns its market lists and symbol pages into dated tables.
Plans from €169/month · Free project assessment · Reply within 1 business day
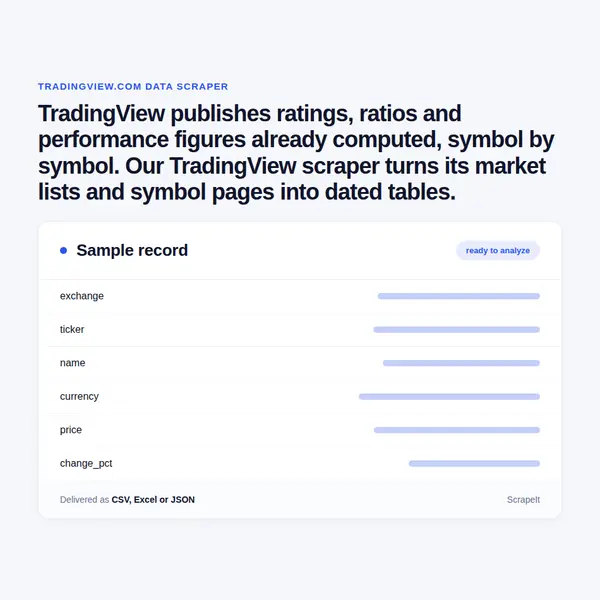
You define the universe - all large-cap stocks of one country, a list of tickers, the crypto ranking, a set of futures, ideas on chosen symbols - together with the column sets and the time of day. We build the crawlers, run them on that clock and repair them when TradingView reworks a table.
Many of its tables are drawn by scripts after the page opens, so rendering, pacing and proxy rotation are part of the service. Every row is stamped with exchange, ticker and collection time, numbers arrive as numbers with their unit and currency beside them, and field documentation comes with the first delivery. Runs can be daily, weekly or on demand, and you can order a sample first.
A symbol is addressed by exchange and ticker - /symbols/NASDAQ-AAPL/, /symbols/LSE-VOD/ - and that pair identifies every row, because one company can trade under several prefixes. From symbol pages and their tabs we return:
Other asset classes bring columns of their own. Coins carry Rank, Circ supply, Vol / mkt cap and Social dom %; currency pairs carry Bid, Ask, High and Low; futures carry High and Low; all three carry a Tech rating. We keep one table per asset class instead of a single wide sheet full of empty columns.
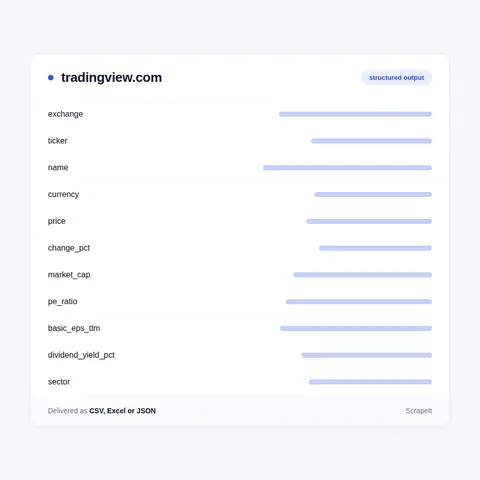
Most projects start from lists, not from single symbols. A long list such as All coins or All futures opens with its first hundred rows and a Load more control, and we page through it to the end:
Nicknames of idea authors are personal data; by default an idea arrives without its author.
TradingView is a charting platform and a community of traders on one site. One half is market data: symbol pages, market lists, screeners, heatmaps and calendars for stocks, indices, ETFs, bonds, crypto, forex, futures and economic indicators. The other half is what its users publish: trading ideas, scripts written in the platform's Pine Script language, and discussion.
The data half is organised by asset class and then by country. Stocks have a section per market - /markets/stocks-usa/, /markets/stocks-india/ and so on - priced in the local currency on the local exchanges, and the site runs in regional and language versions on subdomains such as in.tradingview.com and fr.tradingview.com. A stock is written as exchange plus ticker, so a share listed in two places is two symbols with two price series.
Two properties matter to a buyer. Values come pre-computed: ratings, gauges, performance periods and ratios are ready, which saves rebuilding them from raw prices. And freshness depends on the exchange: crypto exchanges are shown in real time, while many stock and futures exchanges reach an ordinary visitor with a delay. A dataset from these pages is a series of dated snapshots - right for screening, ranking and research, not a tick-by-tick trading record.
Get a Quote
Developers

Customers worldwide

Pages extracted

Hours saved for our clients
€199 / one-time
setup fee - included
€169 / mo
setup fee €499
€229 / mo
setup fee €499
€349 / mo
setup fee €499
€549 / mo
setup fee €799
Delivery: CSV, JSON or XLSX files, our API or a JSON feed. MCP server on request.
Full plan details →TradingView's lists show today's value of each rating, ratio and rank, and tomorrow the same cell holds a new one. Collecting the same pages on a schedule keeps the values that are replaced.
Learn how to use web scraping to solve data problems for your organization

Web scraping automates the extraction and aggregation of financial data, makes it easier to find stocks, and allows you to predict the market based on the information.

Data and analytics are opening the door to uncovering ways to combat financial crime based on smart data. And advanced AI analytics and cognitive techniques, machine learning, and automation will improve the inefficiency of existing investigative processes.

Leveraging advances in technology, the AI-powered web scraper has skyrocketed in demand and is helping to expand capabilities by automating tedious daily tasks and speeding up data collection from thousands of websites several times over.
ScrapeIt runs web scraping as a managed service. On financial sites the craft lies less in a single page than in discipline: the same list collected at the same time every day, symbols keyed by exchange and ticker, units and currencies kept beside every number. We build, run and repair the crawlers for TradingView's public pages and never sign in to an account. A free project assessment comes first. Plans start from EUR 169 a month, or EUR 199 for a one-time extract.
Yes. The ScrapeIt TradingView API returns exchange, ticker, price, Chg %, market capitalization, Tech rating and Analyst rating for the lists you choose as JSON from an endpoint we host, refreshed on the schedule you set. If files suit you better, the tables land as CSV or JSONLines on SFTP or Amazon S3. An MCP server is available on request.
Yes. Symbol pages, market lists, calendars, news headlines and published ideas can be read on TradingView without signing in. We collect only publicly available data - everything a visitor can see on TradingView - and we collect it legally. Nicknames of idea authors are personal data and are not delivered by default.
It depends on the exchange. TradingView shows crypto exchanges in real time, while many stock and futures exchanges reach an ordinary visitor with a delay, and our rows record what the page displayed at the moment of collection. Each row carries that timestamp, so the dataset is a dated snapshot and not a live stream.
Yes. You give us the screen - market, filters and column sets - and every run returns its rows as CSV, Excel or JSON, one row per symbol with the collection time. A TradingView data export of this kind can cover stocks, ETFs, bonds and crypto side by side on a daily or weekly schedule.
Yes, in two ways. The symbol page already carries performance for nine periods from 1 day to All time, and the financial tabs carry annual and quarterly periods. Beyond that, price history is built by repeated runs: every pass stores price, change and volume for each symbol under its date, so the series grows with the schedule.
Step 1 - Make a Request
You share your needs, expectations, and desired timeframe. We’ll suggest the best solution based on your request and budget.
Step 2 - Configuring Custom Web Crawlers
Our specialists configure the crawlers and extract a sample dataset for your review before proceeding with the full-scale extraction.
Step 3 - Collect and Deliver
Once you approve the sample, we launch the project and start full data collection. We gather, filter, and structure the data for easy use, delivering it on time in your preferred format.
Step 4 - Maintain and Support
Our team manages ongoing processes, monitors website changes, and supports all data extraction cycles. We can also help integrate data into your systems or create dashboards to simplify analysis.
TradingView data from €169/month. Free project assessment, reply within 1 business day.

Scrapeit Sp. z o.o.
10/208 Legionowa str., 15-099, Bialystok, Poland
NIP: 5423457175
REGON: 523384582