Tilastokeskus Scraper for StatFin Tables and Key Figures

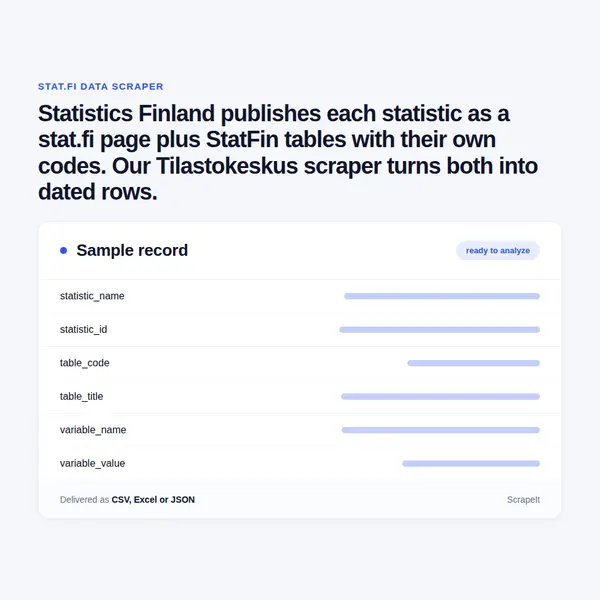
Statistics Finland publishes each statistic as a stat.fi page plus StatFin tables with their own codes. Our Tilastokeskus scraper turns both into dated rows.

Plans from €169 a month · Free project assessment · Reply within 1 business day

CSV · Excel · JSON · XML · FTP · SFTP · Amazon S3 · Google Cloud

stat.fi
Tilastokeskus Scraper for StatFin Tables and Key Figures
stat.fiwhat you get
Typical fields for public registers
record_identity_namestatusregistered_ataddressdocument_url
Delivery

API, JSON feed or CSV, XLSX and JSON files

Schedule

One-time, monthly, weekly, daily or 3 times a day

Scrape Tilastokeskus as a managed service

  1. You send

    Tilastokeskus pages, filters, fields and a schedule

  2. We run the scrapers

    Built, monitored and repaired by our team

  3. You receive the data

    API, JSON feed or CSV, XLSX and JSON files

You name the statistics you follow - consumer prices, dwelling prices by postal code area, unemployment, bankruptcies - and the breakdowns you need, and we set up the collection. We build the crawlers, run them on your schedule and repair them when stat.fi or a StatFin table changes shape. Anti-bot handling and pacing are part of the service.

Statistics Finland writes its pages in Finnish, Swedish and English, and the same table carries Finnish variable names in one version and English in another. We fix one language per project and keep the original codes beside the labels, so a value from a Finnish page and one from an English page land in the same column. Files come as CSV, Excel, JSON or JSONLines, or we push them to SFTP, Amazon S3 or your database; field documentation is included.

Tilastokeskus data: fields we extract

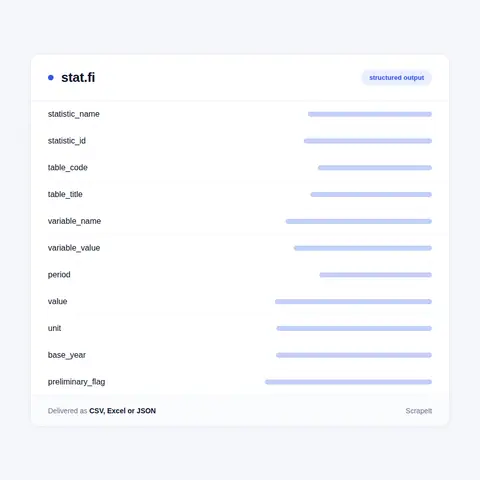
A statistic on stat.fi has a fixed set of sections. In Finnish the page lists Avainluvut (key figures), Kuviot (figures), Taulukot (tables), Tietokantataulukot (database tables), Julkaisut (releases) and Dokumentaatio (documentation), and every figure on it carries a Päivitetty (updated) date. Behind the page sit the StatFin database tables, each with a short table code and a set of variables. We collect both layers:

  • Statisticname in Finnish and English, its short identifier from the address (khi for the consumer price index, ashi for prices of dwellings in housing companies), related topics and the description of the data source.
  • Key figuresheadline value, unit, reference period and updated date, such as inflation and the Elinkustannusindeksi (cost-of-living index) on the consumer price page.
  • Database tablestable code, full table title, the period it covers, updating frequency (month, quarter, year) and the last updated timestamp.
  • Variables and valuesevery dimension of a table with its codes and labels. A dwelling price table by postal code area, for example, crosses Information (price per square metre, number of sales), Year, Postal code and Building type, from one-room flats in blocks of flats to terraced houses.
  • Time seriesone row per period and dimension combination, with monthly, quarterly and yearly periods in StatFin's own notation and a preliminary flag where the latest periods carry an asterisk.
  • Releasesheadline, statistic, reference period, release date, the Key selections bullets, and the database tables listed as updated with that release.

Index tables are kept with their base year in a separate column, so a price index on two different bases never ends up mixed in one series.

Tilastokeskus data: fields we extract
Releases, revisions and the Tilastokeskus dataset over time

Releases, revisions and the Tilastokeskus dataset over time

Official figures move after they are published, and Statistics Finland says so in public. Statistic pages carry Correction and Change notices, the dwelling price statistic has a Data revisions section with tables of how the price index and number of sales changed between releases, and the newest periods are marked as preliminary. A single pass would miss all of that. Repeated runs keep each published value with the date we saw it, so the Tilastokeskus dataset shows the first estimate, every revision and the final figure side by side.

The Future releases calendar lists upcoming publications by date and the languages each one appears in - FI, SV and EN - which lets us schedule a run for the morning a statistic is due instead of polling all week.

Beyond single statistics, stat.fi offers Paavo, statistics by postal code area, and municipal key figures, both handy for regional work. We can merge them with StatFin tables on postal code or municipality code. The data are aggregates: no record describes a person.

How Statistics Finland organises stat.fi and StatFin

Source
stat.fi
Category
public registers
Delivery
API, JSON feed, CSV, XLSX
Plans
From €169 a month
Get a quote

Tilastokeskus, Statistics Finland in English, is the national statistics agency, based in Helsinki. Its site, stat.fi, runs in all three languages and is built around a directory of statistics: each statistic has a page of its own under an address with a short Finnish identifier, grouped into topics such as prices and consumption, housing and construction, or transport and tourism. The directory also lists statistics from other producers of Official Statistics of Finland, each publishing on its own pages.

The home page shows a strip of headline key figures - preliminary population, the cost-of-living index, inflation and the unemployment rate from the labour force survey - followed by the latest releases and the release calendar.

Detailed numbers live in the StatFin database, organised in one folder per statistic, from accommodation statistics and adoptions onwards. A user picks a table, chooses values for each variable and then views the result, and a table can hold far more cells than one screen shows. For anyone who needs the full breakdown rather than the headline, that variable selection is where the work is.

25Developers
500+Customers
1.5BPages extracted
15,000+Hours saved for our clients

Tilastokeskus scraping plans and pricing

Airplane

€199one-time

Setup fee included

100,000
One-time
Up to 5 days
7 days

Helicopter

€169/ mo

Setup fee €499

250,000
Monthly
Up to 5 days
14 days

Glasses

€229/ mo

Setup fee €499

1,000,000
Weekly
Up to 5 days
30 days

Microscope popular

€349/ mo

Setup fee €499

2,000,000
Daily
Same day
60 days

DNA

€549/ mo

Setup fee €799

3,000,000
3 times daily
Same day
90 days

Delivery: CSV, JSON or XLSX files, our API or a JSON feed. MCP server on request.

Full plan details

Why scrape Statistics Finland data

Most buyers want Statistics Finland data inside their own models rather than on a web page. The consumer price index and its commodity group tables feed contract indexation, pricing and inflation forecasts; the cost-of-living index is published as a separate monthly point figure, so index clauses tied to it get that series on its own.

Housing is the second big use. Prices per square metre and number of sales by postal code area and building type, together with the quarterly price index, give property investors, banks and valuation firms a neighbourhood view of the market and let them compare old and new dwellings in housing companies.

Labour and business statistics - the unemployment rate, bankruptcies, new enterprises, building permits - serve as macro signals for credit risk and sales planning. Researchers and consultancies use regional tables by municipality to size markets. In every case the work is the same: the right variables, a stable series over time and a clear record of what was revised.

About ScrapeIt

ScrapeIt builds the crawlers, keeps them running and delivers data in the shape your analysts already use. Statistical agencies are a particular kind of source: few pages, but wide tables, several languages and figures that get revised. We turn them into long, documented series with codes kept intact. A sample of your tables can be ordered before you commit. Plans start from EUR 169 a month, or EUR 199 for a one-time extract.

FAQ

Still unsure? Write to info@scrapeit.io

Do you offer a Tilastokeskus API for StatFin tables?

Yes. The ScrapeIt Tilastokeskus API returns the table code, variable codes and labels, period, value, preliminary flag and updated date as JSON from an endpoint we host, refreshed on the schedule you set. You can also take it as CSV, Excel or JSONLines files on SFTP or Google Cloud Storage. An MCP server is available on request.

Is it legal to scrape Tilastokeskus?

Yes. Statistic pages, key figures, releases and StatFin tables on stat.fi are open to any visitor without an account, and they hold aggregate figures rather than personal records. We collect only publicly available data - everything a visitor can see on Tilastokeskus - and we collect it legally.

Can you track the Tilastokeskus consumer price index every month?

Yes. The Kuluttajahintaindeksi (consumer price index) is published monthly, with inflation, the cost-of-living index and the harmonised index alongside it. We collect the headline figures and the commodity group tables after each release and keep every base year in its own series.

Can you scrape StatFin tables by postal code area?

Yes. Several StatFin tables break figures down by postal code area or municipality, such as prices per square metre and number of sales of old dwellings by building type. We select every postal code and building type in a table and deliver one row per area, year and measure.

How often is Tilastokeskus data updated, and do you capture revisions?

Each StatFin table states its updating frequency - monthly, quarterly or yearly - and stat.fi announces upcoming publications in its Future releases calendar. We schedule runs on those dates and store every published value with the date we collected it, so preliminary figures and their revisions stay visible.

How it works

  1. 1

    Make a request

    You share your needs, expectations, and desired timeframe. We'll suggest the best solution based on your request and budget.

  2. 2

    We configure the crawlers

    Our specialists configure the crawlers and extract a sample dataset for your review before proceeding with the full-scale extraction.

  3. 3

    Collect and deliver

    Once you approve the sample, we launch the project and start full data collection. We gather, filter, and structure the data for easy use, delivering it on time in your preferred format.

  4. 4

    Maintain and support

    Our team manages ongoing processes, monitors website changes, and supports all data extraction cycles. We can also help integrate data into your systems or create dashboards to simplify analysis.

Request a quote

Tell us which sites, which fields and how often. A couple of lines is enough to start.

  • We reply within 1 business day
  • A sample dataset before the full run
  • We sign an NDA on request
  • Delivery by API, JSON feed or files
Which sites, which fields, how often. A couple of lines is enough.

This form is protected by Google reCAPTCHA, which loads when you start filling it in; the Google Privacy Policy and Terms of Service apply. If you prefer not to use it, email us at info@scrapeit.io. Privacy & Cookie Policy

We reply within 1 business day. No obligation.

Tilastokeskus data from €169/month. Free project assessment, reply within 1 business day.