WHO Data Collection for Indicators and Fact Sheets

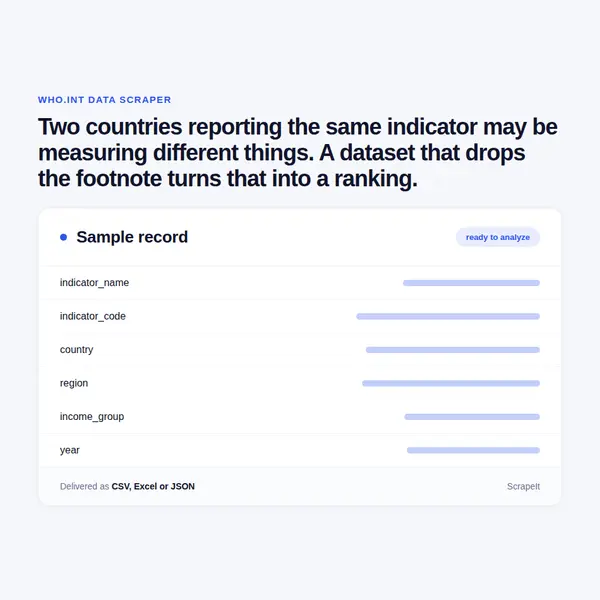
Two countries reporting the same indicator may be measuring different things. A dataset that drops the footnote turns that into a ranking.

WHO Scraper
Solutions

Managed global health data, run end to end by us

ScrapeIt runs the collection as a managed service. You name the indicators, countries or topics; we build the pipeline with comparability notes and data type on every row, definition breaks flagged, and hand back CSV, JSON, Excel or a push into your warehouse.

Gaps stay gaps. We do not interpolate missing country-years, because the gaps correlate with what is being measured and filling them biases the result while hiding that it did.

We collect published material politely. Reuse terms apply to this organisation's material and we record them rather than assuming a public body means unrestricted - your counsel should see the intended use, especially for anything commercial.

WHO fields in every export

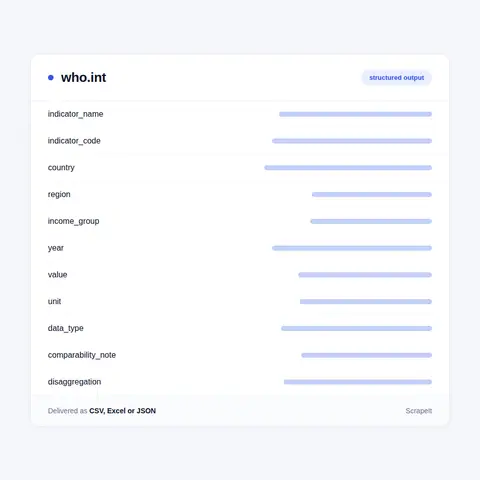
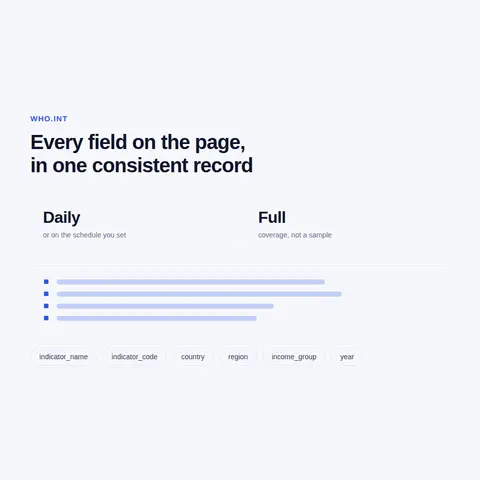
Indicator records carry the indicator name and code, country, region, year, value, unit, and the disaggregation where published - sex, age group, urban or rural.

Comparability notes travel with the value rather than in separate documentation. Where the source qualifies a figure - estimated rather than reported, different definition, incomplete coverage - that qualification is a field on the row. It is the single most important design decision on this source.

Data type is recorded: reported by the country, estimated by the organisation, or modelled. Those three are different epistemic objects and treating them as one number produces analysis that cannot be defended.

Fact sheet records carry the topic, section structure, publication and update dates, and the text, kept separate from the statistical records because guidance and measurement are different things.

Every row carries the collection timestamp and the source address.

WHO fields in every export
Time series, regional aggregates and licensing

Time series, regional aggregates and licensing

Time series assembly is the main deliverable and it needs definition breaks flagged rather than smoothed. A series annotated with its methodology changes is usable; one that looks continuous and is not will eventually produce a wrong conclusion nobody can trace.

Regional and income group aggregates are published alongside country figures and are worth collecting as their own records, since they are computed by the organisation rather than derived by a user and carry their own methodology.

Fact sheet monitoring tracks how guidance on a disease or risk factor changes, which for public health communication work is a different and useful product from the statistics.

On licensing: the organisation publishes terms for reuse of its material, commonly permitting non-commercial use with attribution and treating commercial use differently. We record what applies rather than assuming a public body means unrestricted, and your counsel should see the intended use, particularly for a commercial product.

Global indicators and the footnotes that qualify them

The World Health Organization publishes global health statistics, disease fact sheets, guidelines and country profiles. Its Global Health Observatory carries indicators covering mortality, disease burden, health systems, risk factors and coverage, by country and year.

The defining problem with this data is comparability. Countries differ in how they collect, define and report health statistics, and the organisation documents those differences in notes attached to the data. Those notes are where the analytical honesty lives, and they are exactly what a careless pipeline drops on the way to a tidy table.

A dataset of indicator values without its caveats produces country rankings that look authoritative and compare, in some cases, genuinely different measurements. That is a serious error in a field where the numbers inform funding and policy.

The data and fact sheet sections respond directly. The crawl rules are an unusual document: a long named blocklist of several hundred crawlers, with no general rule at all and a sitemap index at the end. Absence of a rule is not an endorsement, so we pace politely regardless.

Get a Quote
dev_w
25

Developers

customers
500+

Customers worldwide

pages
1 500 000 000+

Pages extracted

stime
15000+

Hours saved for our clients

Plans

Airplane

€199 / one-time

setup fee - included

Data limits100,000
Frequencyone-time
Run timeup to 5 days
Data storing7 days

Helicopter

€169 / mo

setup fee €499

Data limits250,000
Frequencymonthly
Run timeup to 5 days
Data storing14 days

Glasses

€229 / mo

setup fee €499

Data limits1,000,000
Frequencyweekly
Run timeup to 5 days
Data storing30 days

DNA

€549 / mo

setup fee €799

Data limits3,000,000
Frequency3 times daily
Run timesame day
Data storing90 days

Why the caveats are the dataset's integrity

Global health data is the clearest case in this catalogue where the footnotes matter as much as the figures.

A country with a functioning civil registration system reports mortality from records. A country without one has its mortality estimated from surveys and models. Both appear as a number against a country and a year. Ranked side by side without their data type, they produce a comparison that a health statistician would not make and that a spreadsheet makes effortlessly.

The same applies to definitions. Indicator definitions are revised over time and adopted by countries at different moments, so a multi-year series can contain a definitional break that looks exactly like an epidemiological trend.

The third issue is coverage. Not every country reports every indicator every year, and gaps are not random - they correlate with the health system capacity being measured. A dataset that silently interpolates or drops missing values biases the result in a predictable direction and hides that it did so.

The fourth is that the organisation publishes this data to be used, which makes the access question straightforward and puts all the difficulty in handling it responsibly - where it belongs.

Our Blog

Reads Our Latest News & Blog

Learn how to use web scraping to solve data problems for your organization

How Artificial Intelligence Is Used In Web Scraping

How Artificial Intelligence Is Used In Web Scraping

Leveraging advances in technology, the AI-powered web scraper has skyrocketed in demand and is helping to expand capabilities by automating tedious daily tasks and speeding up data collection from thousands of websites several times over.

What is Web Scraping and What is it Used For?

What is Web Scraping and What is it Used For?

Web scraping is a method of obtaining web data by extracting it from pages of web resources with the help of a program, that is, in automatic mode. It is used to syntactically convert web pages into more usable forms.

Web Scraping for Machine Learning

Web Scraping for Machine Learning

If you specialize in machine learning, you need to feed large amounts of data to the algorithms. Web scraping is the easiest and the most efficient method of collecting the data from all over the Internet.

scrapeit logo

Who builds and keeps your global health feed

ScrapeIt is a managed extraction company, not a tool you have to learn. Our team builds the pipeline, tracks indicator definition changes as they are published, and repairs the collector before a multi-year series acquires an unexplained break.

You see a sample first, in your format, over the indicators you actually use, with data type and caveats attached so you can see on real countries what a bare value would have hidden.

FAQ

Why keep the footnotes on every row?

Because they are what stops a comparison being wrong. A figure reported from civil registration and one estimated from surveys look identical as numbers and are different objects - ranked side by side without that field, they produce a comparison no health statistician would make.

Will you fill missing country-years?

No. Gaps correlate with the health system capacity being measured, so interpolating biases the result in a predictable direction while hiding that it happened. Gaps stay gaps and are marked as such.

Can I build a long time series?

Yes, with definition breaks flagged rather than smoothed. Indicator definitions are revised and adopted by countries at different times, so a break can look exactly like an epidemiological trend to anyone reading a continuous-looking line.

Are the regional aggregates just sums?

No, they are computed by the organisation with their own methodology, which is why we collect them as their own records rather than deriving them. A user-computed aggregate and the published one can legitimately differ.

Can I use this commercially?

That depends on the terms the organisation publishes, which commonly treat non-commercial and commercial use differently. We record what applies to the material rather than assuming a public body means unrestricted, and the decision belongs with your counsel.

How does it Work?

Step 1 - Make a Request

You share your needs, expectations, and desired timeframe. We’ll suggest the best solution based on your request and budget.

Step 2 - Configuring Custom Web Crawlers

Our specialists configure the crawlers and extract a sample dataset for your review before proceeding with the full-scale extraction.

Step 3 - Collect and Deliver

Once you approve the sample, we launch the project and start full data collection. We gather, filter, and structure the data for easy use, delivering it on time in your preferred format.

Step 4 - Maintain and Support

Our team manages ongoing processes, monitors website changes, and supports all data extraction cycles. We can also help integrate data into your systems or create dashboards to simplify analysis.

Request a Quote

Tell us more about you and your project information.
Which sites, which fields, how often. A couple of lines is enough.

We reply within 1 business day. No obligation.

scrapiet

Scrapeit Sp. z o.o.
10/208 Legionowa str., 15-099, Bialystok, Poland
NIP: 5423457175
REGON: 523384582