Why revisions make a published table worth collecting
It would be reasonable to ask why anyone should collect statistics that are already published as tables, and the answer is entirely about time.
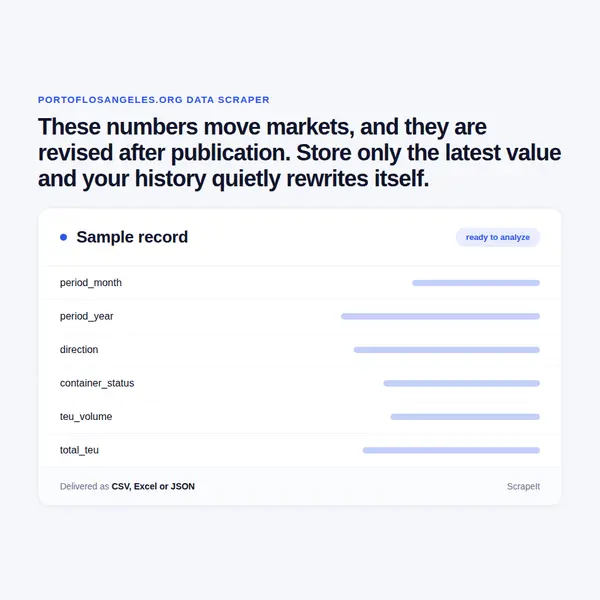
A published table shows the current value for each period. What it does not show is what that value was last month, and monthly port statistics are revised. For anyone using these figures as an economic indicator, the difference between the first published number and the revised one is itself information - it is the nowcasting error, and it can only be measured if the original was recorded.
The second reason is cross-port comparison. Major container ports each publish their own statistics in their own formats and conventions, and assembling them onto one schema is the work. Once assembled, the relative movements say more than any single port does, because a shift between ports is a routing decision rather than a demand change.
The third is the loaded and empty split, which is genuinely informative at a port with a large structural imbalance. Empty repositioning volumes reflect the cost of that imbalance and move differently from trade.
The fourth is that these are public statistics from a public agency, which makes this among the least encumbered sources in this catalogue.