QS World University Rankings Scraper for Scores, Subjects and Profiles

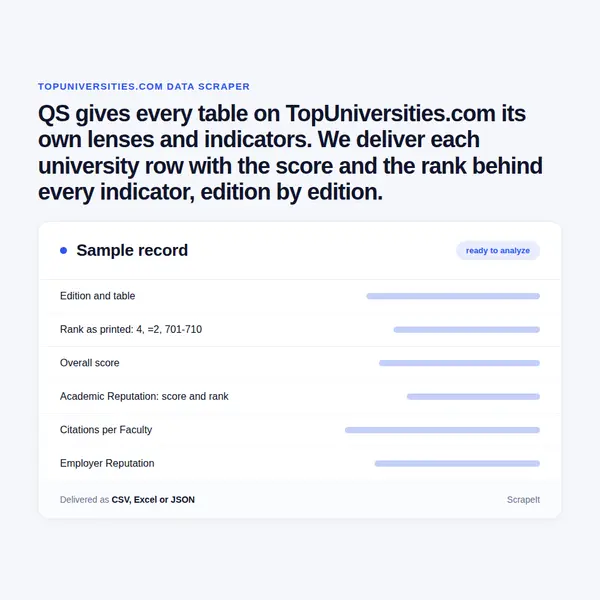
QS gives every table on TopUniversities.com its own lenses and indicators. We deliver each university row with the score and the rank behind every indicator, edition by edition.

Plans from €169/month · Free project assessment · Reply within 1 business day

QS World University Rankings Scraper
Solutions

How We Scrape QS World University Rankings Tables and Profiles

ScrapeIt runs QS World University Rankings data scraping as a managed service: we build the collector, host it and fix it when the site changes. Anti-bot handling, proxy rotation and CAPTCHA solving are part of the job. We walk each table and edition you pick, then the profiles and programme pages they link to, and extract QS World University Rankings data from public pages only, never behind a login. Each row keeps the edition, the table, the QS institution ID and the time it was read. A sample comes first; after sign-off, runs follow the release calendar and land as JSON, a QS rankings CSV or a QS rankings Excel file, in S3, SFTP or your warehouse.

QS World University Rankings Indicators, Scores and Ranks per Row

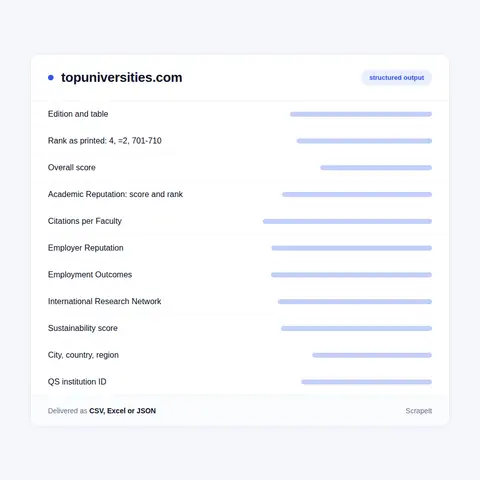
A row holds what a visitor sees in the Quick View and the Table View, plus the rank QS gives each indicator. Ranks stay as printed, and QS prints three kinds: a plain position, a tie with an equals sign (=2, currently shared by Imperial College London and Stanford) and, below 700, a band such as 701-710, 851-900 or 1001-1200, down to 1401+. Banded rows show n/a where the overall score would be.

  • University. Name as ranked, city, country or territory, region, profile URL and the QS institution ID.
  • World table. Overall rank and score, then Academic Reputation and Citations per Faculty, Faculty Student Ratio, Employer Reputation and Employment Outcomes, International Student Ratio, International Research Network and International Faculty Ratio, and the Sustainability score - each with its own rank, banded at 701+ or 801+.
  • Subject tables. Academic Reputation, Employer Reputation, Citations per Paper and H-index Citations, with International Research Network in most subjects; the current table for Data Science and Artificial Intelligence ranks 201 universities, Computer Science and Information Systems 849.
  • Regional tables. The QS Asia University Rankings add Papers per Faculty, Staff with PhD and Inbound and Outbound Exchange; the Latin America and Arab Region tables add Web Impact.
  • QS Sustainability Ranking. Environmental Impact, Social Impact and Governance, with sub-scores such as Equality, Knowledge Exchange and Health and Wellbeing.
  • Cities and business schools. QS Best Student Cities scores 150 cities on Rankings, Student Mix, Desirability, Employer Activity, Affordability and Student View. The QS Global MBA Rankings score Thought Leadership, Return On Investment, Entrepreneurship and Alumni Outcomes, Employability and Diversity.
  • Flags. A QS Stars rating where the university holds one, and the dagger QS puts on rows corrected after release.

QS World University Rankings Indicators, Scores and Ranks per Row
QS Ranking Historical Data, University Profiles and Programme Pages

QS Ranking Historical Data, University Profiles and Programme Pages

For a QS ranking history, edition pages run from the 2021 table, which listed 1,186 universities, to the 2027 edition, published in June 2026 with more than 1,500. The layout changed on the way: the 2024 edition added Employment Outcomes, International Research Network and Sustainability to the six older indicators. A QS ranking database for trend work therefore stores each edition's indicator set, and the edition name, which runs a year ahead of the release. Subject pages rename too: the 2023 Data Science table is now Data Science and Artificial Intelligence.

The same Top Universities scraper then opens the profiles. They show the world rank with subject, sustainability and regional ranks, institution status (Public for Imperial, Private not for Profit for MIT), programme counts by level, entry scores for TOEFL, IELTS, SAT, GMAT and GPA, starting tuition for domestic and international students, yearly cost of living in USD, student and staff totals with undergraduate, postgraduate and international shares, and campus addresses. Where a university lists awards, scholarships come with study level, value and deadline. Programme pages add duration, tuition per year, application deadline, starting month, degree and study mode.

QS World University Rankings Data on TopUniversities.com

A QS World University Rankings scraper reads topuniversities.com, the student site of Quacquarelli Symonds, where QS publishes its rankings next to university profiles, programme pages and study guides. The flagship QS World University Rankings 2027 table currently ranks more than 1,500 universities. Around it sit the QS World University Rankings by Subject, regional tables for Asia, Europe, Latin America and the Caribbean and the Arab Region, the QS Sustainability Ranking, QS Best Student Cities and the business school tables: the QS Global MBA Rankings, QS Business Masters Rankings, Executive MBA and International Trade.

Every table follows one grammar. A lens groups related indicators, each indicator is scored and ranked on its own, and the indicator scores roll up into an overall score and a rank. The current QS World University Rankings are based on nine indicators in five lenses: Research and Discovery, Learning Experience, Employability, Global Engagement and Sustainability. Subject, regional and business tables swap in their own indicator sets, so no two families share one column layout.

Each university has one profile at /universities/ plus a slug, such as /universities/imperial-college-london, and business schools sit one level below their university, as MIT Sloan does under MIT. Ranking rows also carry a QS institution ID, the same in every table and edition, so a university's rows join without matching on names.

Get a Quote
dev_w
25

Developers

customers
500+

Customers worldwide

pages
1 500 000 000+

Pages extracted

stime
15000+

Hours saved for our clients

Plans

QS World University Rankings Scraping Plans and Pricing

Airplane

€199 / one-time

setup fee - included

Data limits100,000
Frequencyone-time
Run timeup to 5 days
Data storing7 days

Helicopter

€169 / mo

setup fee €499

Data limits250,000
Frequencymonthly
Run timeup to 5 days
Data storing14 days

Glasses

€229 / mo

setup fee €499

Data limits1,000,000
Frequencyweekly
Run timeup to 5 days
Data storing30 days

DNA

€549 / mo

setup fee €799

Data limits3,000,000
Frequency3 times daily
Run timesame day
Data storing90 days

Who Buys a QS World University Rankings Dataset, and Why

University planning offices come first. The overall rank hides where the points come from: Harvard is currently fifth in the world table while ranking first on Academic Reputation, Citations per Faculty, Employer Reputation and Employment Outcomes, and =285 on Sustainability. Strategy teams track their own indicator ranks against a comparator group, and they want every edition in one QS ranking dataset instead of a screenshot per year.

Recruitment agencies, course-matching apps and edtech platforms come second. A student asks about a subject, a city and a budget, not about the world table, so these teams join subject ranks to profile data: programmes by level, tuition, entry scores, scholarships and the share of international students.

The third group reads the tables in aggregate. Ministries, investors and consultancies count universities per country, region and city in each band, follow a national system from one edition to the next and set the QS ranking scores beside their own data on enrolment, research funding or graduate hiring. Best Student Cities adds the city view, and the MBA tables add business schools.

Our Blog

Reads Our Latest News & Blog

Learn how to use web scraping to solve data problems for your organization

How Artificial Intelligence Is Used In Web Scraping

How Artificial Intelligence Is Used In Web Scraping

Leveraging advances in technology, the AI-powered web scraper has skyrocketed in demand and is helping to expand capabilities by automating tedious daily tasks and speeding up data collection from thousands of websites several times over.

What is Web Scraping and What is it Used For?

What is Web Scraping and What is it Used For?

Web scraping is a method of obtaining web data by extracting it from pages of web resources with the help of a program, that is, in automatic mode. It is used to syntactically convert web pages into more usable forms.

Web Scraping for Machine Learning

Web Scraping for Machine Learning

If you specialize in machine learning, you need to feed large amounts of data to the algorithms. Web scraping is the easiest and the most efficient method of collecting the data from all over the Internet.

scrapeit logo

Ordering QS Rankings Data as Files or a QS Rankings API

ScrapeIt is a managed web scraping agency. You name the tables, editions, subjects, regions and profile fields; we deliver a QS ranking dataset that loads without cleaning: rows, indicator scores and ranks, universities, programmes and scholarships, joined on the QS institution ID, as files or through a QS rankings API we host. Pricing for a QS feed follows the number of tables and editions and how often they refresh, and you check a sample before committing.

FAQ

Do you offer a QS World University Rankings API?

Yes. The ScrapeIt QS World University Rankings API returns ranking rows as JSON: edition, table, rank as printed, overall score, every indicator score with its own rank, university name, city, country, region, QS institution ID and profile URL, plus profile and programme fields if you add them. You set the schedule, from a run on each release day to a monthly pass over the profiles. The same data comes as CSV and XLSX exports, or lands in S3, SFTP or your warehouse.

Can you collect the QS World University Rankings by Subject and by region?

Yes. The subject rankings cover five broad subject areas and 55 subjects, from Accounting and Finance to Veterinary Science, and each table has its own size. The regional rankings cover Asia with four sub-regions, Europe with five, Latin America and the Caribbean with three, and the Arab Region, each with its own indicators. Every row keeps its subject or region, so a university appears once per table it is ranked in, with the rank and scores it holds there.

When are QS rankings released, and how often should the data refresh?

Each family has its own date. In the current cycle the world table came out in June under the next year's name, subject tables in March, the Asia and sustainability tables in November, Best Student Cities in July and the Global MBA table in September. QS also posts corrections in a release summary: a corrected university moves to its new position without shifting others, so two rows can share a rank or a gap can open. We time scraping QS pages to each release and add a lighter weekly pass for corrections and profile changes.

How are QS rankings calculated, and do you keep the weights?

The QS ranking methodology page lists a weight for every lens and indicator: Academic Reputation 30%, Citations per Faculty 20%, Employer Reputation 15%, Faculty Student Ratio 10%, and 5% each for Employment Outcomes, International Faculty Ratio, International Research Network, International Student Ratio and Sustainability. QS reviews the weights every year, so we store them per edition beside the indicator scores, and you can test your own weighting on the same inputs.

Is it legal to scrape QS World University Rankings?

We collect only publicly available data - everything a visitor can see on QS World University Rankings - and we collect it legally. That covers ranking tables, indicator scores and ranks, methodology and release summary pages, university profiles and programme pages. No logins, no paywalls: filters that need a QS account and saved shortlists stay out. Rankings describe institutions, not people; names in testimonials and bylines are dropped, and personal data is handled under GDPR.

How does it Work?

Step 1 - Make a Request

You share your needs, expectations, and desired timeframe. We’ll suggest the best solution based on your request and budget.

Step 2 - Configuring Custom Web Crawlers

Our specialists configure the crawlers and extract a sample dataset for your review before proceeding with the full-scale extraction.

Step 3 - Collect and Deliver

Once you approve the sample, we launch the project and start full data collection. We gather, filter, and structure the data for easy use, delivering it on time in your preferred format.

Step 4 - Maintain and Support

Our team manages ongoing processes, monitors website changes, and supports all data extraction cycles. We can also help integrate data into your systems or create dashboards to simplify analysis.

Request a Quote

Tell us more about you and your project information.
Which sites, which fields, how often. A couple of lines is enough.

We reply within 1 business day. No obligation.

scrapiet

Scrapeit Sp. z o.o.
10/208 Legionowa str., 15-099, Bialystok, Poland
NIP: 5423457175
REGON: 523384582