Times Higher Education Scraper for University Rankings

A ranking position is one number hiding five. The pillar scores underneath it are where an institution actually moved, and they are on the same page.

Times Higher Education Scraper
Solutions

Managed university ranking data, run end to end by us

ScrapeIt runs the collection as a managed service. You name the ranking families, editions and institutions; we build the pipeline, run the historical backfill and the annual updates, and hand back CSV, JSON, Excel or a push into your warehouse, with pillar scores intact, banded ranks preserved as bands and institution identity normalised across years and families.

Cadence here is annual with the editions, plus a check around publication dates, since rankings do not change between releases. That makes this an unusually cheap dataset to keep current once the backfill exists.

Ranking tables and their scores are the publisher's compilation and are copyrighted as such, so the dataset is built for internal analysis and benchmarking rather than for republication of the tables. We collect what the site renders publicly, honour the crawl rules it publishes and pace requests. Bring the use case to your own counsel before the project starts, particularly if the output will appear in marketing material.

University ranking fields in every export

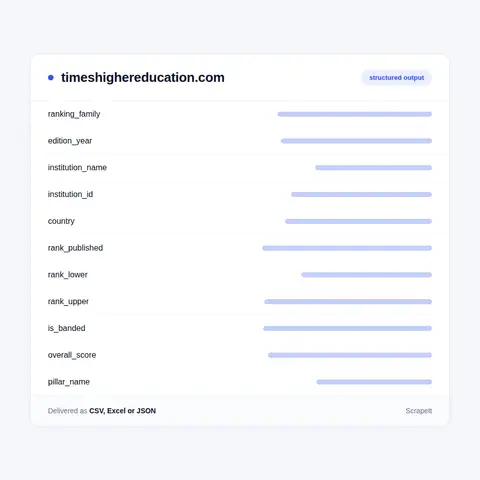
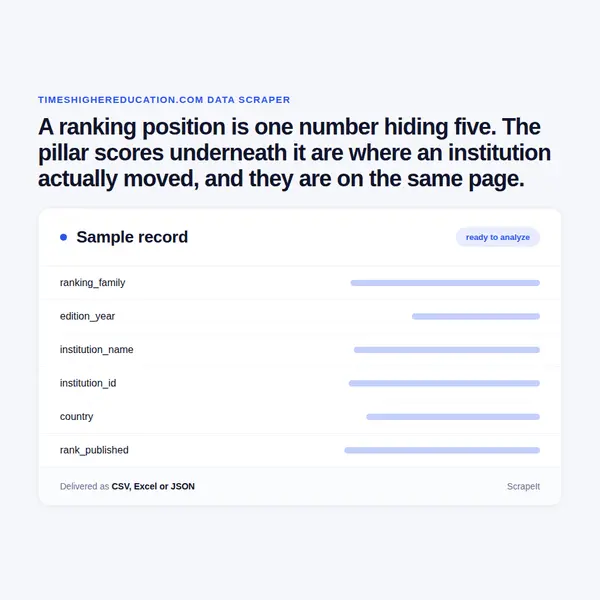
The ranking record covers ranking family, edition year, institution name, country, overall rank as published including banded ranks, overall score, and each pillar score the methodology reports.

Banded ranks need explicit handling and most naive collectors get this wrong. Beyond a certain position, institutions are published in bands rather than as single numbers, and storing a band as a single integer invents precision that does not exist. We keep the band as published alongside a numeric lower and upper bound, so any chart drawn from it can be honest about the uncertainty.

Institution identity is normalised across families and years. The same university appears with different name renderings between tables and over time, and without normalisation a trend line breaks silently in the year a name was rendered differently. We resolve them to one identifier and keep every surface form.

Profile fields are joined where published: country, student numbers, staff to student ratio, international student proportion and subject areas.

Change fields are computed rather than left to the client: position change against the previous edition, score change per pillar, and entry or exit from the table. Every row carries the edition year and the collection timestamp.

University ranking fields in every export
Historical editions, banded ranks and cross-ranking joins

Historical editions, banded ranks and cross-ranking joins

Historical editions are the bulk of the value here and the bulk of the work. Past tables remain published, so a multi year panel is buildable as a one time job, and once it exists the ongoing collection is a small annual addition. Most clients underestimate how much of the cost sits in the backfill and how little in keeping it current.

Banded ranks recur often enough to deserve repeating: past the top few hundred, positions are published as ranges. Storing the midpoint as if it were a rank produces charts that show movement where none was reported. We store the band, its bounds and a flag, and any aggregate we deliver respects them.

Cross ranking joins are the standard extension. Different ranking families use different methodologies and produce different orders, and an institution comparing itself across several needs them on one identifier with the methodology recorded per table. We do that normalisation during collection.

Institution profile data is joined where it is published, which gives context to a position: size, international share, staff ratio. That context is often what makes a comparison fair, because comparing a small specialist institution with a large comprehensive one on an unadjusted score is not a comparison at all.

How the rankings are published and what sits under each position

Times Higher Education publishes several ranking families: a world university ranking, subject rankings, regional and reputation rankings, and rankings aimed at particular institution types. Each is published annually as a table with a position per institution, and each table is available for past years, which is what makes trend work possible.

Under each headline position sits a set of pillar scores. An institution has an overall score and component scores across the areas the methodology weights, and those components are where the movement actually happens. An institution rising twenty places on the strength of one pillar and one falling on four while holding position are opposite stories that the rank alone hides completely.

Institutions have their own profile pages carrying descriptive information, student numbers, staff to student ratio, international student share and subject areas, which joins to the ranking table by institution.

The tables themselves are the collection target, and they are large: hundreds to well over a thousand rows per ranking, per year, with the score columns beside each position. Year over year comparison requires all of them, which is a bulk job rather than a live feed.

Get a Quote
dev_w
25

Developers

customers
500+

Customers worldwide

pages
1 500 000 000+

Pages extracted

stime
15000+

Hours saved for our clients

Plans

Airplane

€199 / one-time

setup fee - included

Data limits100,000
Frequencyone-time
Run timeup to 5 days
Data storing7 days

Helicopter

€169 / mo

setup fee €499

Data limits250,000
Frequencymonthly
Run timeup to 5 days
Data storing14 days

Glasses

€229 / mo

setup fee €499

Data limits1,000,000
Frequencyweekly
Run timeup to 5 days
Data storing30 days

DNA

€549 / mo

setup fee €799

Data limits3,000,000
Frequency3 times daily
Run timesame day
Data storing90 days

Why the pillar scores matter more than the position

A ranking position is a compressed number and compression loses the reason. An institution that gained fifteen places because one pillar improved has a very different story from one that gained fifteen because two rivals fell, and only the component scores separate them. Any institutional strategy built on rank alone is reacting to a summary rather than to the underlying facts.

Methodologies also change between editions, and that is the trap in every long ranking trend chart. Weightings are revised, metrics are added and definitions shift, so a movement between two years can be an artefact of the method rather than a change in the institution. Collecting the pillar scores makes that visible: if every institution in a category moved the same way, the method changed. If a single institution moved, it moved.

The third use is competitive benchmarking at the pillar level. For a university planning where to invest, knowing that its research pillar sits below a comparator group while its teaching pillar sits above is actionable in a way that a single position never is.

The fourth is subject level analysis. A university strong overall can be weak in a particular subject and the reverse, and subject tables are where a faculty level conversation actually starts. That means collecting several ranking families and joining them on a normalised institution identifier.

The fifth is entry and exit. Institutions appearing in a table for the first time, or dropping out, is a signal that the position column alone does not carry.

Our Blog

Reads Our Latest News & Blog

Learn how to use web scraping to solve data problems for your organization

How Artificial Intelligence Is Used In Web Scraping

How Artificial Intelligence Is Used In Web Scraping

Leveraging advances in technology, the AI-powered web scraper has skyrocketed in demand and is helping to expand capabilities by automating tedious daily tasks and speeding up data collection from thousands of websites several times over.

What is Web Scraping and What is it Used For?

What is Web Scraping and What is it Used For?

Web scraping is a method of obtaining web data by extracting it from pages of web resources with the help of a program, that is, in automatic mode. It is used to syntactically convert web pages into more usable forms.

Web Scraping for Machine Learning

Web Scraping for Machine Learning

If you specialize in machine learning, you need to feed large amounts of data to the algorithms. Web scraping is the easiest and the most efficient method of collecting the data from all over the Internet.

scrapeit logo

Who builds and keeps your rankings dataset

ScrapeIt is a managed extraction company, not a tool you have to learn. Our team builds the pipeline, runs the backfill, watches the tables as editions publish, and repairs the collector before your panel develops a gap.

You see a sample first, in your format, for the ranking families and comparator group you actually track, with pillar scores and banded ranks handled correctly so you can judge the awkward parts on real rows.

FAQ

Can you get the scores under each ranking position?

Yes, and they are the point. An overall score plus the pillar components the methodology reports sit alongside each position. A rank alone cannot tell you whether an institution improved or a rival fell; the components can. Any strategy built on the position column alone is reacting to a summary.

How do you handle ranks published as bands?

By keeping them as bands. Past the top few hundred, positions are published as ranges, and storing a midpoint as if it were a rank invents precision and produces charts showing movement that was never reported. We store the band as published with numeric bounds and a flag, and any aggregate respects them.

Can I compare positions across several years?

Yes, with one caveat we build in rather than bury. Methodologies change between editions, so movement can be an artefact of the method. Because we collect the pillar scores, that is detectable: if a whole category moved together, the method changed; if one institution moved, it moved. Institution names are also normalised across years so a trend line does not break the year a name was rendered differently.

Do you collect subject rankings as well as the world table?

Yes, and for faculty level work they matter more. A university strong overall can be weak in a subject and the reverse. Several ranking families are collected and joined on a normalised institution identifier, with the methodology recorded per table so nobody compares two orders that were built differently.

Can I republish the ranking tables from this data?

No. The tables and their scores are the publisher's compilation and copyrighted as such. The dataset is built for internal analysis and benchmarking. If the output is destined for marketing material or a public report, take that to your own counsel first, because the answer depends on how much of the compilation you intend to reproduce.

How does it Work?

Step 1 - Make a Request

You share your needs, expectations, and desired timeframe. We’ll suggest the best solution based on your request and budget.

Step 2 - Configuring Custom Web Crawlers

Our specialists configure the crawlers and extract a sample dataset for your review before proceeding with the full-scale extraction.

Step 3 - Collect and Deliver

Once you approve the sample, we launch the project and start full data collection. We gather, filter, and structure the data for easy use, delivering it on time in your preferred format.

Step 4 - Maintain and Support

Our team manages ongoing processes, monitors website changes, and supports all data extraction cycles. We can also help integrate data into your systems or create dashboards to simplify analysis.

Request a Quote

Tell us more about you and your project information.
Which sites, which fields, how often. A couple of lines is enough.

We reply within 1 business day. No obligation.

scrapiet

Scrapeit Sp. z o.o.
10/208 Legionowa str., 15-099, Bialystok, Poland
NIP: 5423457175
REGON: 523384582