Fever Scraper for Experiences, Sessions and Price Tiers

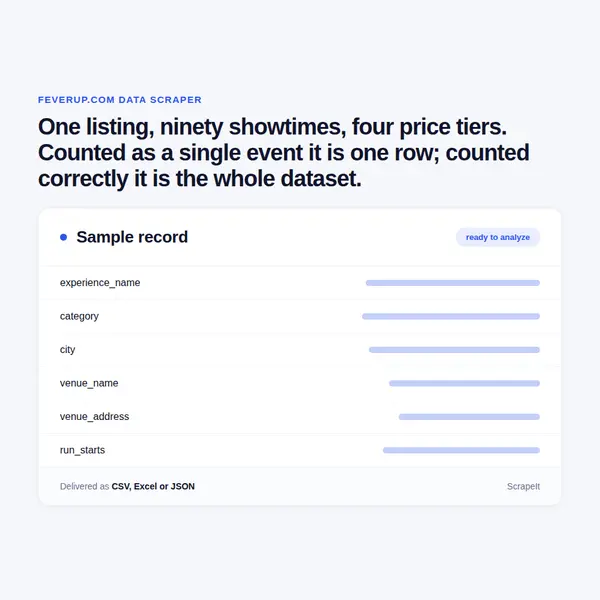
One listing, ninety showtimes, four price tiers. Counted as a single event it is one row; counted correctly it is the whole dataset.

Fever Scraper
Solutions

Managed experience inventory, run end to end by us

ScrapeIt runs the collection as a managed service. You name the cities and categories; we build the pipeline with sessions and price tiers as their own records, keep the experience as their parent, and hand back CSV, JSON, Excel or a push into your warehouse.

Where sell-out behaviour matters we run repeat collection at a cadence matched to how fast the sessions move, and keep every observation rather than overwriting, because the curve is the product.

We collect published inventory data only, honour the crawl rules the site publishes and pace requests. No attendee data, no account access. Terms restrict commercial reuse of the content, so the dataset is for analysis rather than republication, and your counsel should see the use case before the project starts.

Fever fields in every export

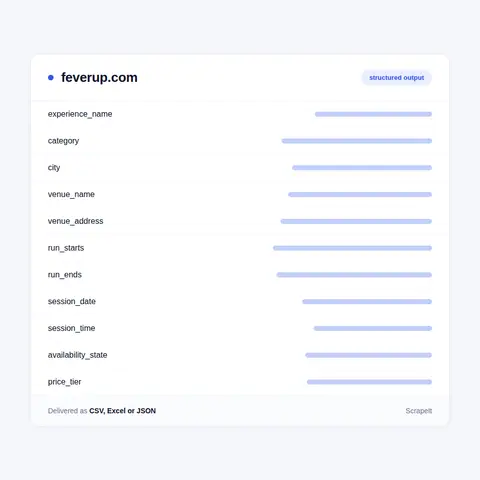
The experience record covers the experience name, category, city, venue name and address, description, duration, age restrictions and the run dates from first to last session.

The session record is separate and keyed to the experience: date, start time, and availability state as published. That is where the analysis lives, because a season of sessions describes demand in a way a single listing never can.

Price tiers are their own rows. A candlelight concert with four seating tiers is four prices, and flattening them to a single figure - usually the lowest, sometimes the highest - produces a price series that is wrong in whichever direction the flattening chose.

City is a first class field, because this platform is organised by city and a national aggregate mixes markets with completely different pricing and supply.

Every row carries the collection timestamp, which is what makes a sold-out state interpretable rather than just a flag.

Fever fields in every export
Sell-out curves, city comparison and scope

Sell-out curves, city comparison and scope

Sell-out curve analysis is the strongest output and the one that requires the most discipline: repeat collection of the same sessions, keeping every observation, so that the path from available to sold out is recorded rather than just the endpoint. It is a straightforward pipeline and an impossible retrofit.

City comparison answers what an operator launches where, at what price, and how supply per capita differs between markets. It runs off the experience and session lists and needs no availability tracking, which makes it a good first project.

Category mix over time shows what is expanding and what is being quietly retired, which for anyone in live entertainment is a read on where the format is going.

What we leave alone is people. The crawl rules disallow profile pages and we would skip them regardless: no attendee data, no account access, no reviews tied to named individuals. Experience, session, capacity state and price need none of it.

Curated experiences rather than a listings board

Fever is an experience discovery platform operating across cities in Europe, North America and beyond. It is not a listings aggregator in the usual sense: much of its inventory is produced or licensed by the platform itself - immersive exhibitions, candlelight concerts, seasonal experiences - rather than collected from third party promoters.

That changes the shape of the data. A traditional event listing is one show on one night. A Fever experience is a production that runs for weeks or months, with dozens or hundreds of sessions, often several per day, each with its own capacity, availability and price tiers.

Treating an experience as a single event collapses all of that into one row and throws away everything worth measuring. The session is the unit that matters, and the experience is the parent it hangs from.

City pages respond directly with substantial content and crawl rules are published, disallowing profile pages, login and the merchandise shop - none of which an inventory project needs.

Get a Quote
dev_w
25

Developers

customers
500+

Customers worldwide

pages
1 500 000 000+

Pages extracted

stime
15000+

Hours saved for our clients

Plans

Airplane

€199 / one-time

setup fee - included

Data limits100,000
Frequencyone-time
Run timeup to 5 days
Data storing7 days

Helicopter

€169 / mo

setup fee €499

Data limits250,000
Frequencymonthly
Run timeup to 5 days
Data storing14 days

Glasses

€229 / mo

setup fee €499

Data limits1,000,000
Frequencyweekly
Run timeup to 5 days
Data storing30 days

DNA

€549 / mo

setup fee €799

Data limits3,000,000
Frequency3 times daily
Run timesame day
Data storing90 days

Why the session is the unit of analysis

The default brief is a list of events in a city. Delivered literally it produces a few hundred rows that look like a complete picture and answer none of the questions that follow.

What clients actually want to know is how much is on offer, at what prices, and how fast it sells. All three are session level facts. An experience running twice a day for three months is a large amount of supply; the same experience in a one-row list is indistinguishable from a single evening show.

The second reason is that price tiers are the product. This platform sells the same session at several prices, and the spread between the cheapest and the most expensive tier is a deliberate commercial decision worth tracking on its own.

The third is availability over time. Sessions sell out, and which ones sell out first - weekday or weekend, early or late, cheap tier or premium - is a demand signal that only exists if somebody observed the same session more than once. It cannot be recovered from a snapshot taken after the fact.

The fourth is that the inventory is largely first party. Because Fever produces much of what it sells, its catalogue is a readable record of what an experience operator thinks will work in each city, which is a different and often more useful signal than an open listings board.

Our Blog

Reads Our Latest News & Blog

Learn how to use web scraping to solve data problems for your organization

How Artificial Intelligence Is Used In Web Scraping

How Artificial Intelligence Is Used In Web Scraping

Leveraging advances in technology, the AI-powered web scraper has skyrocketed in demand and is helping to expand capabilities by automating tedious daily tasks and speeding up data collection from thousands of websites several times over.

What is Web Scraping and What is it Used For?

What is Web Scraping and What is it Used For?

Web scraping is a method of obtaining web data by extracting it from pages of web resources with the help of a program, that is, in automatic mode. It is used to syntactically convert web pages into more usable forms.

Web Scraping for Machine Learning

Web Scraping for Machine Learning

If you specialize in machine learning, you need to feed large amounts of data to the algorithms. Web scraping is the easiest and the most efficient method of collecting the data from all over the Internet.

scrapeit logo

Who builds and keeps your Fever feed

ScrapeIt is a managed extraction company, not a tool you have to learn. Our team builds the pipeline, watches it as city pages and session templates change, and repairs it before a sell-out curve develops a hole in the middle.

You see a sample first, in your format, over the cities you actually track, with sessions and tiers expanded so you can judge the structure on a real experience rather than on a description of one.

FAQ

Why one row per session instead of per event?

Because an experience here runs for weeks with several sessions a day. As one row it is indistinguishable from a single evening show, which destroys any measure of supply, pricing spread or how fast things sell - the three things clients actually ask about.

How do you handle several prices for one session?

Each tier is its own row. Flattening them to a single figure means choosing the lowest or the highest, and the resulting price series is wrong in whichever direction that choice went. The spread between tiers is itself worth tracking.

Can you tell me what sold out and when?

From the point collection started, yes, as a curve rather than a flag. It requires observing the same sessions repeatedly and keeping every observation. A snapshot taken after the fact shows only that something is sold out, never when or how fast.

Can you cover several cities at once?

Yes, and city stays a field rather than being aggregated away. The platform is organised by city and a national total mixes markets with different pricing and supply, so per-city comparison is usually the more useful deliverable.

Do you collect anything about attendees?

No. The crawl rules disallow profile pages and we would skip them anyway - no attendee data, no account access, no reviews tied to named individuals. Experience, session, capacity state and price need none of it.

How does it Work?

Step 1 - Make a Request

You share your needs, expectations, and desired timeframe. We’ll suggest the best solution based on your request and budget.

Step 2 - Configuring Custom Web Crawlers

Our specialists configure the crawlers and extract a sample dataset for your review before proceeding with the full-scale extraction.

Step 3 - Collect and Deliver

Once you approve the sample, we launch the project and start full data collection. We gather, filter, and structure the data for easy use, delivering it on time in your preferred format.

Step 4 - Maintain and Support

Our team manages ongoing processes, monitors website changes, and supports all data extraction cycles. We can also help integrate data into your systems or create dashboards to simplify analysis.

Request a Quote

Tell us more about you and your project information.
Which sites, which fields, how often. A couple of lines is enough.

We reply within 1 business day. No obligation.

scrapiet

Scrapeit Sp. z o.o.
10/208 Legionowa str., 15-099, Bialystok, Poland
NIP: 5423457175
REGON: 523384582