How Can Web Scraping Technology Help the Finance Industry?
Web scraping automates the extraction and aggregation of financial data, makes it easier to find stocks, and allows you to predict the market based on the information.
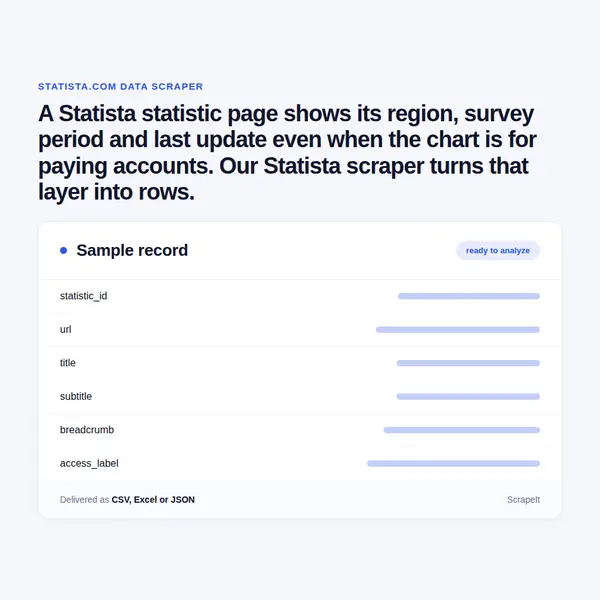
A Statista statistic page shows its region, survey period and last update even when the chart is for paying accounts. Our Statista scraper turns that layer into rows.
Plans from €169 a month · Free project assessment · Reply within 1 business day
CSV · Excel · JSON · XML · FTP · SFTP · Amazon S3 · Google Cloud
API, JSON feed or CSV, XLSX and JSON files
ScheduleOne-time, monthly, weekly, daily or 3 times a day
Statista pages, filters, fields and a schedule
Built, monitored and repaired by our team
API, JSON feed or CSV, XLSX and JSON files
Most Statista projects start from a list: a set of topic pages, an industry in the breadcrumb, a keyword, or a spreadsheet of statistic URLs your analysts already cite. We turn it into a crawl plan, build the crawler, run it once or on a schedule and keep it running when Statista changes its templates. Pages are rendered the way a browser shows them, and pacing, proxy rotation and CAPTCHA handling are part of the job, not something you arrange. Every statistic comes back as one row of metadata and, for Basic statistics, a second table of the values the chart shows, linked by the statistic id. The free assessment tells you up front how many of your target statistics are Basic and how many are Premium.
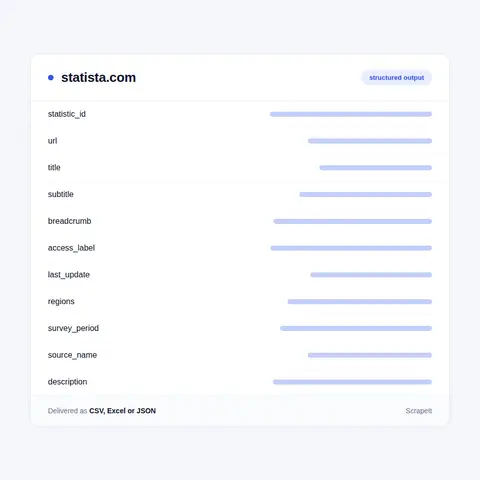
Every statistic page has a permanent address: /statistics/, a numeric id, then a slug. Titles are rewritten for each new edition and the slug often keeps the wording of an older one, so the statistic id, not the slug, is the row key. Fields we collect from public statistic pages:
The output is a catalogue table with one row per statistic and a values table with one row per data point, both carrying the date of the run.
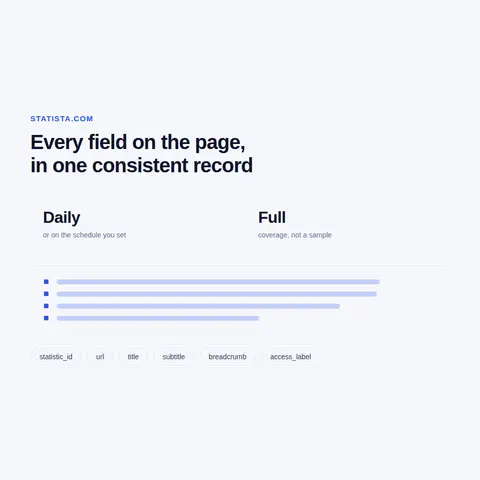
One statistic is rarely the job. Useful Statista datasets come from walking the structure around it.
Statista is a statistics portal established in Germany in 2007. It gathers figures from market research firms, trade bodies, statistics offices, company reports and its own surveys, and republishes each one as a statistic page with a chart, a short explanatory text and the details of where the number came from. Statista keeps the source, the publisher and whoever conducted a survey apart, and under each chart a Source link names the publication behind the figures.
Content is arranged by industry, from Economy & Politics to Internet or Advertising & Marketing, then by subcategory such as Brands & Leaders, with topic pages gathering the statistics of one subject. Each statistic page also carries an Ask AI button and a Related insights list of neighbouring statistics and articles.
Access is split in two. Basic Statistics show their chart and values without an account; Premium Statistics need a paid plan, and on those pages the chart is blurred, its values are withheld and the figures in the text turn into asterisks. The shell - title, region, survey period, last update, Source link, description, related insights - stays visible either way. A Statista scraper therefore delivers the catalogue layer for any statistic and the values for Basic ones, and nothing that needs a paid account.
Delivery: CSV, JSON or XLSX files, our API or a JSON feed. MCP server on request.
Full plan detailsMany reports, decks and articles take their numbers from Statista, so its catalogue is a map of which figures exist, how recent they are and who produced them.
Learn how to use web scraping to solve data problems for your organization

Web scraping automates the extraction and aggregation of financial data, makes it easier to find stocks, and allows you to predict the market based on the information.
Data and analytics are opening the door to uncovering ways to combat financial crime based on smart data. And advanced AI analytics and cognitive techniques, machine learning, and automation will improve the inefficiency of existing investigative processes.
Data scraping is the wide term that includes documents, scans and old screens; web scraping is the part that works on websites. We compare sources, daily work, output and cost drivers, give a briefing checklist and walk through two of our projects.

ScrapeIt is a team that builds and operates web crawlers for clients and hands over the results as datasets. For statistics portals like Statista we work at catalogue level - ids, sources, update dates - and add values only where the page shows them to every visitor. Each delivery comes with field documentation, as XLSX, CSV or JSONLines files, through our API, or to Google Cloud Storage or Amazon S3. Plans start from EUR 169 a month, or EUR 199 for a one-time extract.
Still unsure? Write to info@scrapeit.io
Yes. The ScrapeIt Statista API returns statistic id, title, region, survey time period, last update, source and, for Basic statistics, the chart values, as JSON from an endpoint we host, on the refresh schedule you set. The same records come as CSV files, a JSON feed or a load into your database. An MCP server is available on request.
Yes. Statistic titles, regions, survey periods, update dates and descriptions are shown to every visitor, and Basic statistics show their values as well. We collect only publicly available data - everything a visitor can see on Statista without a paid account - and we collect it legally. Premium values are not part of the delivery.
Statista compiles figures from outside publishers - market researchers, associations, statistics offices, companies - and from its own research and surveys, and names the source on each statistic. Where that source is a third-party publication, we can scrape it directly and deliver it next to the Statista record, often in more detail than the chart.
Yes. We start from the topic pages or the industry branch you name, list every statistic with its Basic or Premium label, then collect metadata for all of them and values for the Basic ones. You receive a catalogue table keyed on the statistic id and a values table with one row per data point.
Rankings such as the brand value lists are re-issued under the same id with each new edition, and the Last update field says when a page last changed. A monthly run usually catches new editions; a weekly run suits a team following a fast-moving topic.
You share your needs, expectations, and desired timeframe. We'll suggest the best solution based on your request and budget.
Our specialists configure the crawlers and extract a sample dataset for your review before proceeding with the full-scale extraction.
Once you approve the sample, we launch the project and start full data collection. We gather, filter, and structure the data for easy use, delivering it on time in your preferred format.
Our team manages ongoing processes, monitors website changes, and supports all data extraction cycles. We can also help integrate data into your systems or create dashboards to simplify analysis.
Tell us which sites, which fields and how often. A couple of lines is enough to start.
Statista data from €169/month. Free project assessment, reply within 1 business day.