How Can Web Scraping Technology Help the Finance Industry?
Web scraping automates the extraction and aggregation of financial data, makes it easier to find stocks, and allows you to predict the market based on the information.
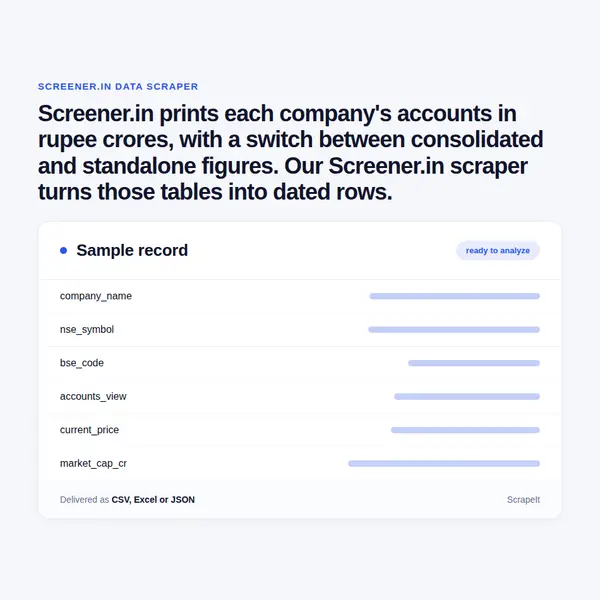
Screener.in prints each company's accounts in rupee crores, with a switch between consolidated and standalone figures. Our Screener.in scraper turns those tables into dated rows.
Plans from €169 a month · Free project assessment · Reply within 1 business day
CSV · Excel · JSON · XML · FTP · SFTP · Amazon S3 · Google Cloud
API, JSON feed or CSV, XLSX and JSON files
ScheduleOne-time, monthly, weekly, daily or 3 times a day
Screener.in pages, filters, fields and a schedule
Built, monitored and repaired by our team
API, JSON feed or CSV, XLSX and JSON files
You tell us which companies matter - a watchlist of NSE symbols and BSE codes, every name in an industry such as IT - Software, or the results of a public screen like Magic Formula - and which sections of the company page you need. We build the crawler, run it on the schedule you choose and repair it whenever Screener.in reworks a table. Rupee values written with Indian lakh and crore comma grouping arrive as plain numbers, with the unit kept in its own column. Pacing, proxy rotation and rendering are part of the service, and field documentation comes with the first delivery. Runs can be one-off, weekly once the reporting season is over, or daily for prices and new announcements.
Every company on Screener.in lives at /company/ plus its NSE symbol, or its six-digit BSE code when the stock trades on BSE only, with /consolidated/ appended for group accounts. We keep that identifier, both exchange codes and the view on every row, because one company carries two different sets of numbers.
Banks read differently. For lenders Screener.in replaces Sales and Operating Profit with Revenue, Financing Profit and Financing Margin %, adds Gross NPA % and Net NPA % to the quarterly table and shows Deposits on the balance sheet. These stay separate columns rather than being forced into the industrial template, so a bank row never carries an empty OPM.
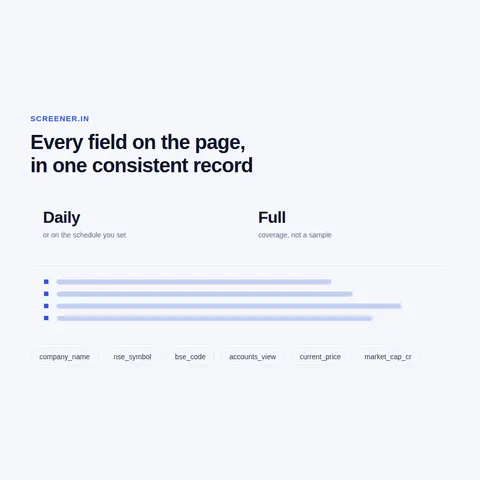
A single company page is a snapshot. The value of the site for a dataset lies in how it links companies together and in what accumulates between visits.
Screen authors and the individual holders listed behind shareholding line-items are natural persons, so their names stay out by default.
Screener.in is a stock analysis and screening tool for Indian equities, run by Mittal Analytics Private Ltd. It covers companies listed on the National Stock Exchange and on BSE, and each page names the BSE code and, where the stock trades on NSE, the NSE symbol. Prices are not live: the footer marks BSE data as delayed by 5 minutes and NSE data by 15, and the quoted price carries the date of the close it refers to.
The company page is one long document divided into tabs - Summary, Chart, Analysis, Peers, Quarters, Profit & Loss, Balance Sheet, Cash Flow, Ratios, Investors and Documents. Figures are given in Rs. Crores, and a link switches between consolidated and standalone accounts. Companies sit in a four-level industry tree that runs from a broad sector such as Industrials through Capital Goods down to Aerospace & Defense, and the same tree drives the Browse sectors list on the explore page.
A free account and a premium tier sit on top of the public layer. Screener AI, commodity prices, shareholder search, announcement alerts and parts of the Insights block, such as headcount, ask the visitor to log in or upgrade. Screener.in also notes that FII and DII classifications may have changed from September 2022, when the new XBRL format added more detail, so a jump in those lines at that quarter may be a relabelling. Our datasets cover the public company, screen and industry pages; nothing behind the paywall is promised.
Delivery: CSV, JSON or XLSX files, our API or a JSON feed. MCP server on request.
Full plan detailsScreener.in has already done the dull part of Indian equity research: every company it carries is laid out in the same tabs, with ratios computed the same way. Collected in bulk, that format becomes a research table.
We deliver data, not recommendations: what you buy or sell on it is your call.
Learn how to use web scraping to solve data problems for your organization
Web scraping automates the extraction and aggregation of financial data, makes it easier to find stocks, and allows you to predict the market based on the information.
Data and analytics are opening the door to uncovering ways to combat financial crime based on smart data. And advanced AI analytics and cognitive techniques, machine learning, and automation will improve the inefficiency of existing investigative processes.
Data scraping is the wide term that includes documents, scans and old screens; web scraping is the part that works on websites. We compare sources, daily work, output and cost drivers, give a briefing checklist and walk through two of our projects.

ScrapeIt is a managed web scraping company. We build and run crawlers for financial portals, exchanges and filing systems and deliver the results as files or through our API. For Screener.in that means a fixed schema for statements, ratios and shareholding, unit columns for crores and percentages, and field notes that say where each column sits on the page. A free project assessment comes first, then a sample on your own companies. Plans start from EUR 169 a month, or EUR 199 for a one-time extract.
Still unsure? Write to info@scrapeit.io
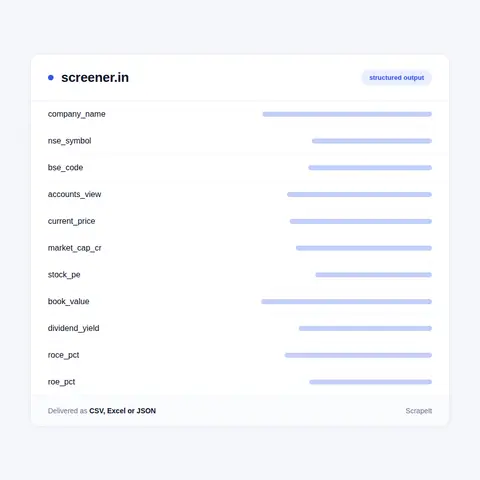
Yes. The ScrapeIt Screener.in API returns quarterly results, profit and loss lines, balance sheet items, ratios such as ROCE and ROE, and the shareholding pattern as JSON from an endpoint we host, updated on the schedule you choose. The same tables can also come as CSV or XLSX files, a JSON feed or a load into your database.
Yes. Company pages, public screens and industry tables on Screener.in open to any visitor without an account. We collect only publicly available data - the layer every Screener.in visitor sees - and we collect it legally. Premium features are not part of what we deliver; insight values shown only to signed-in visitors can be added on an account registered through Screener.in's sign-up form or on your own account.
Give us the industry names, a public screen or a list of NSE symbols and BSE codes. We resolve each to its company URL, collect the consolidated and standalone views where both exist, and return one row per company and period. The industry path travels with every row, so the sector can be re-cut later without another run.
Yes. The annual tables on a company page start years back - from March 2015 for a long-listed name such as TCS - and the quarterly table shows the most recent quarters, so the first run already brings a back history. After that, scheduled runs add each new quarter and keep dated snapshots of price, Stock P/E and the shareholding split.
Prices on Screener.in trail the exchanges by minutes and change every trading day, while statements change only when a company files results. Most projects refresh prices and ratios daily or weekly and statements after each reporting week. Deliveries go out as CSV, Excel or a JSON feed, or straight to your Amazon S3 bucket.
You share your needs, expectations, and desired timeframe. We'll suggest the best solution based on your request and budget.
Our specialists configure the crawlers and extract a sample dataset for your review before proceeding with the full-scale extraction.
Once you approve the sample, we launch the project and start full data collection. We gather, filter, and structure the data for easy use, delivering it on time in your preferred format.
Our team manages ongoing processes, monitors website changes, and supports all data extraction cycles. We can also help integrate data into your systems or create dashboards to simplify analysis.
Tell us which sites, which fields and how often. A couple of lines is enough to start.
Screener.in data from €169/month. Free project assessment, reply within 1 business day.