TickPick Scraper for Fee-Inclusive Resale Prices

Here the price on the listing is the price you pay. Almost nowhere else in resale is that true, which is exactly why this source is worth collecting.

TickPick Scraper
Solutions

Managed resale price data, run end to end by us

ScrapeIt runs the collection as a managed service. You name the events, performers or categories; we build the pipeline with the fee basis recorded, timestamps on every price observation and seating kept as published, and hand back CSV, JSON, Excel or a push into your warehouse.

Prices move continuously, so cadence is set against how fast the market you care about moves rather than a convenient daily default.

We collect published listing data only, honour the crawl rules and pace requests. No buyer or seller identities, no account access. Terms restrict commercial reuse, so the dataset is for analysis rather than republication, and your counsel should see the use case before the project starts.

TickPick fields in every export

Event records carry the event name, performer or team, venue, city, event date and time, and the category.

Listing records carry the section, row where published, quantity available, the all-in price per ticket, the currency and whether the price is fee-inclusive. That last field is not decoration: when this data sits beside another platform's, the flag is what stops the two being averaged.

Price observations carry a timestamp, because resale prices move continuously and a price without a time is not a fact about anything. A single observation per event describes one moment of a market that changes daily.

Seating geography - section and row - is kept as published rather than normalised into a scheme of our own, since venue seating conventions differ and a home-made normalisation would silently misplace listings.

Every row carries the collection timestamp and the event identifier so a price series can be assembled per event.

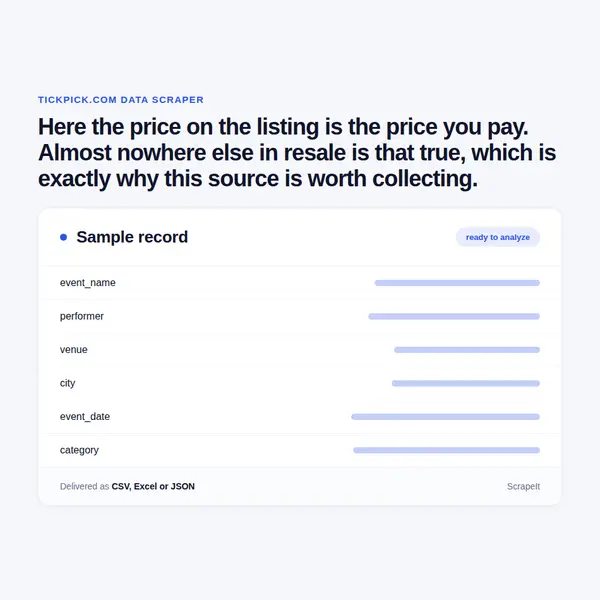
TickPick fields in every export
Price curves, fee comparison and scope

Price curves, fee comparison and scope

Price curve analysis is the strongest output: how asking prices move from listing to event date, by category and by event size. It needs frequent repeat collection and every observation kept, and it is invisible from any snapshot.

Fee structure comparison across platforms is the analysis this source enables rather than provides alone. With a fee-inclusive anchor and the fee basis recorded elsewhere, the real spread between platforms becomes measurable instead of assumed.

Inventory depth - how many listings exist at what price levels - is a supply signal that complements the price series and comes from the same collection.

Scope limits: asking prices, not transactions. No buyer or seller identities, no account access. Resale platforms carry individual sellers and we collect listings as market data rather than building anything about the people behind them.

A resale marketplace that shows the real number

TickPick is a United States ticket resale marketplace covering concerts, sport and theatre. Its distinguishing feature is pricing: listings are shown with fees included rather than added at checkout.

That sounds like a marketing detail and it is a substantial data property. On most resale platforms the number on a listing is a base price, and the amount a buyer actually pays appears several steps later after service fees, delivery fees and taxes are added. The gap is frequently large and it varies by platform, by event and sometimes by price tier.

A dataset built by collecting displayed prices across several resale sites therefore compares numbers that mean different things. It looks like a price comparison and is really a comparison of fee disclosure practices.

This source gives you one side of that comparison with the fees already in, which makes it the natural control. Category and event pages respond directly with substantial content, and crawl rules are published, disallowing the ajax, widget and bidding paths along with parameterised addresses.

Get a Quote
dev_w
25

Developers

customers
500+

Customers worldwide

pages
1 500 000 000+

Pages extracted

stime
15000+

Hours saved for our clients

Plans

Airplane

€199 / one-time

setup fee - included

Data limits100,000
Frequencyone-time
Run timeup to 5 days
Data storing7 days

Helicopter

€169 / mo

setup fee €499

Data limits250,000
Frequencymonthly
Run timeup to 5 days
Data storing14 days

Glasses

€229 / mo

setup fee €499

Data limits1,000,000
Frequencyweekly
Run timeup to 5 days
Data storing30 days

DNA

€549 / mo

setup fee €799

Data limits3,000,000
Frequency3 times daily
Run timesame day
Data storing90 days

Why fee structure decides whether a comparison is real

Resale price comparison is one of the most commonly requested datasets in this category and one of the most commonly delivered wrong.

The error is simple and invisible. Collect displayed prices from four platforms, put them in one table, and you have four columns that look comparable. One of them includes fees; the others do not. Every conclusion about which platform is cheaper is then an artefact of disclosure practice rather than a finding about price.

Doing it properly means recording the fee basis per platform as a field and, where possible, capturing the checkout price rather than the display price. This source makes one column trustworthy by construction, which is why we recommend it as the anchor for any multi-platform study.

The second reason to collect here is the time dimension. Resale prices move as an event approaches, and the shape of that movement - rising for scarce events, collapsing for unsold ones - is the analysis rights holders and venues actually want. It requires repeated observation of the same listings and cannot be reconstructed afterwards.

The third is that this is secondary market data. It describes what resellers ask, not what the primary seller charged and not necessarily what anyone paid. We label it as asking prices rather than letting it be read as transaction data.

Our Blog

Reads Our Latest News & Blog

Learn how to use web scraping to solve data problems for your organization

How Artificial Intelligence Is Used In Web Scraping

How Artificial Intelligence Is Used In Web Scraping

Leveraging advances in technology, the AI-powered web scraper has skyrocketed in demand and is helping to expand capabilities by automating tedious daily tasks and speeding up data collection from thousands of websites several times over.

What is Web Scraping and What is it Used For?

What is Web Scraping and What is it Used For?

Web scraping is a method of obtaining web data by extracting it from pages of web resources with the help of a program, that is, in automatic mode. It is used to syntactically convert web pages into more usable forms.

Web Scraping for Machine Learning

Web Scraping for Machine Learning

If you specialize in machine learning, you need to feed large amounts of data to the algorithms. Web scraping is the easiest and the most efficient method of collecting the data from all over the Internet.

scrapeit logo

Who builds and keeps your resale price feed

ScrapeIt is a managed extraction company, not a tool you have to learn. Our team builds the pipeline, watches it as listing templates change, and repairs it before a price curve develops a hole in the days that mattered.

You see a sample first, in your format, over the events you actually track, with the fee basis flagged so you can see immediately why it matters when a second platform is added.

FAQ

Why does fee-inclusive pricing matter for data?

Because a table of displayed prices from several platforms looks comparable and is not - one column includes fees and the others do not. Conclusions about which platform is cheaper then reflect disclosure practice rather than price. This source gives you one trustworthy column.

Can you compare against other resale platforms?

Yes, and the fee basis has to be recorded per platform for the comparison to mean anything. With a fee-inclusive anchor the real spread becomes measurable instead of assumed, which is the whole point of using this source.

Are these prices what people actually paid?

No - they are asking prices from resellers. They are not primary prices and not transaction records. We label the dataset that way rather than letting asking prices be read as a measure of what a market cleared at.

Can you show how prices move before an event?

Yes, from repeat collection with every observation kept. The shape of that movement - rising for scarce events, collapsing for unsold ones - is what venues and rights holders actually want, and it cannot be reconstructed after the fact.

Do you normalise section and row?

No, they stay as published. Venue seating conventions differ enough that a home-made normalisation would silently misplace listings, which is worse than leaving the original values for you to map deliberately.

How does it Work?

Step 1 - Make a Request

You share your needs, expectations, and desired timeframe. We’ll suggest the best solution based on your request and budget.

Step 2 - Configuring Custom Web Crawlers

Our specialists configure the crawlers and extract a sample dataset for your review before proceeding with the full-scale extraction.

Step 3 - Collect and Deliver

Once you approve the sample, we launch the project and start full data collection. We gather, filter, and structure the data for easy use, delivering it on time in your preferred format.

Step 4 - Maintain and Support

Our team manages ongoing processes, monitors website changes, and supports all data extraction cycles. We can also help integrate data into your systems or create dashboards to simplify analysis.

Request a Quote

Tell us more about you and your project information.
Which sites, which fields, how often. A couple of lines is enough.

We reply within 1 business day. No obligation.

scrapiet

Scrapeit Sp. z o.o.
10/208 Legionowa str., 15-099, Bialystok, Poland
NIP: 5423457175
REGON: 523384582